
Description
What is Splunk?
Splunk is a software platform used for searching, analyzing and visualizing data gathered from websites, applications, servers, and network devices, in real-time. It provides operational intelligence to organizations to quickly identify and resolve issues, uncover insights, and make data-driven decisions. When it comes to security, Splunk can be used as a log management solution but most importantly as an analytics-driven SIEM.
What is Splunk Universal Forwarder?
The Splunk Universal Forwarder is a lightweight version of the Splunk software that is used to collect and forward data to a Splunk indexer. Universal Forwarders are separate downloads that can be installed on any remote source, with little impact on network or host performance.
Reference: https://www.splunk.com/
What is Symon?
System Monitor (Sysmon) is a Windows system service and device driver that, once installed on a system, remains resident across system reboots to monitor and log system activity to the Windows event log. It provides detailed information about process creations, network connections, and changes to file creation time etc.
Reference: https://learn.microsoft.com/en-us/sysinternals/downloads/sysmon
What is Atomic Red Team?
Atomic Red Team is an open-source library of tests mapped to the MITRE ATT&CK framework. It allows security teams to emulate adversarial activities and help test their environments.
Reference: https://github.com/redcanaryco/atomic-red-team
Lab Environment
In this lab environment, GUI access to Ubuntu 20.04 (SOC Machine) and Windows Server 2019 (Target Machine) is provided to you. The Ubuntu machine is provided to you to set up and configure Splunk. The Windows machine is provided to you to set up and configure Splunk Universal Forwarder and Sysmon. Atomic Red Team is also available on the Windows machine that you can use to emulate attacks. A Kali machine is also present.
Your task is to make the necessary set-ups and configurations to forward Sysmon logs to Splunk, which will be running on the Ubuntu machine, and then use appropriate queries to search through and analyze the data as required.
Objective: Forward Sysmon logs to Splunk running on the Ubuntu machine and then run appropriate queries to search through and analyze the data as required.
Below are the tasks that you need to perform:
- Task 1: Set up and configure Splunk (free license) on the Ubuntu machine.
- Task 2: Set up and configure Sysmon and Splunk Universal Forwarder on the Windows machine.
- Task 3: Create and run queries for the following:
- Extract events with a particular Event ID
- List all process execution activity
- List all commands executed by processes
- List all commands executed by a specific process
- Identify the longest cmd.exe command that was executed
- Task 4: Run T1518.001-5 (Sysmon Service Discovery) atomic test and detect its activity.
- Task 5: Run T1547.004-5 (Winlogon HKLM Userinit Key Persistence) atomic test and detect its activity.
- Task 6: Run T1047-1,2 (WMI Reconnaissance Users and Processes) atomic tests and detect their activity.
Tools
The best tools for this lab are:
- Splunk
- Splunk Universal Forwarder
- Sysmon
- Powershell
- Firefox
- Atomic Red Team
Solution
Step 1: Open the lab link to access the following machines:
Ubuntu Machine
Windows Machine
Task 1: Set up and configure Splunk (free license) on the Ubuntu machine.
Step 2: First, go to /root/Desktop/Tools where the Splunk installer file is present. Use it to install Splunk. This might take a few minutes.
Command:
dpkg -i splunk-9.0.3-dd0128b1f8cd-linux-2.6-amd64.deb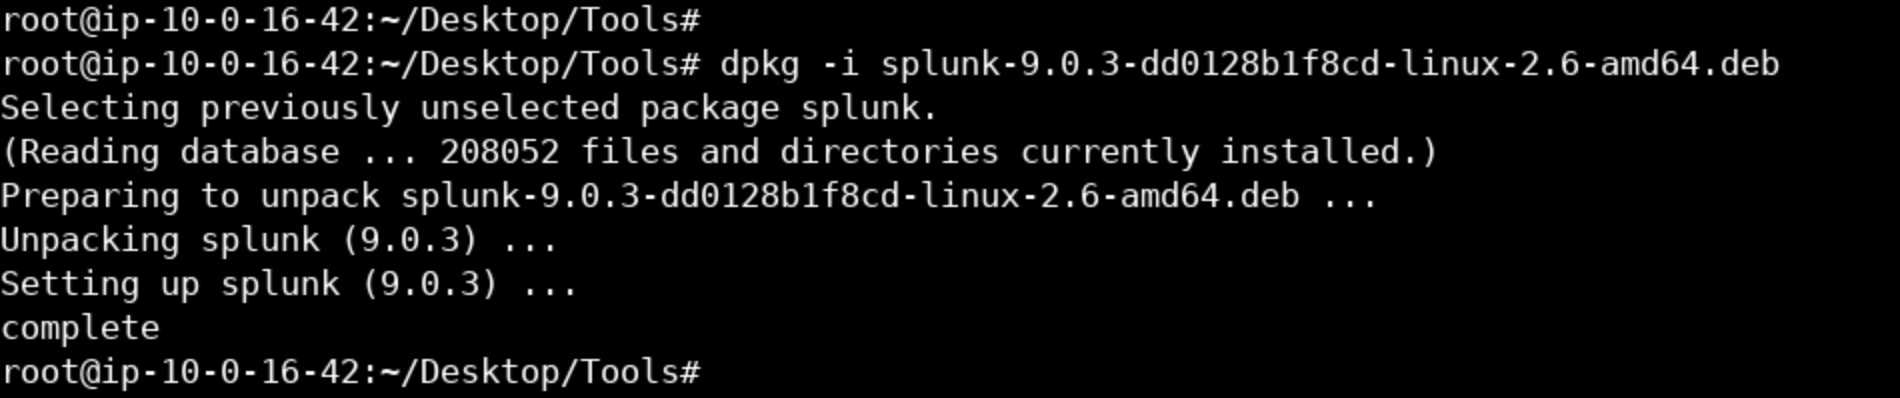
Step 3: Now, navigate to /opt/splunk/bin and then run the following command to start Splunk while accepting the license.
Command:
./splunk start --accept-licenseYou will be prompted to set the administrator username and password. You can set the credentials as follows:
- Username: admin
- Password: password
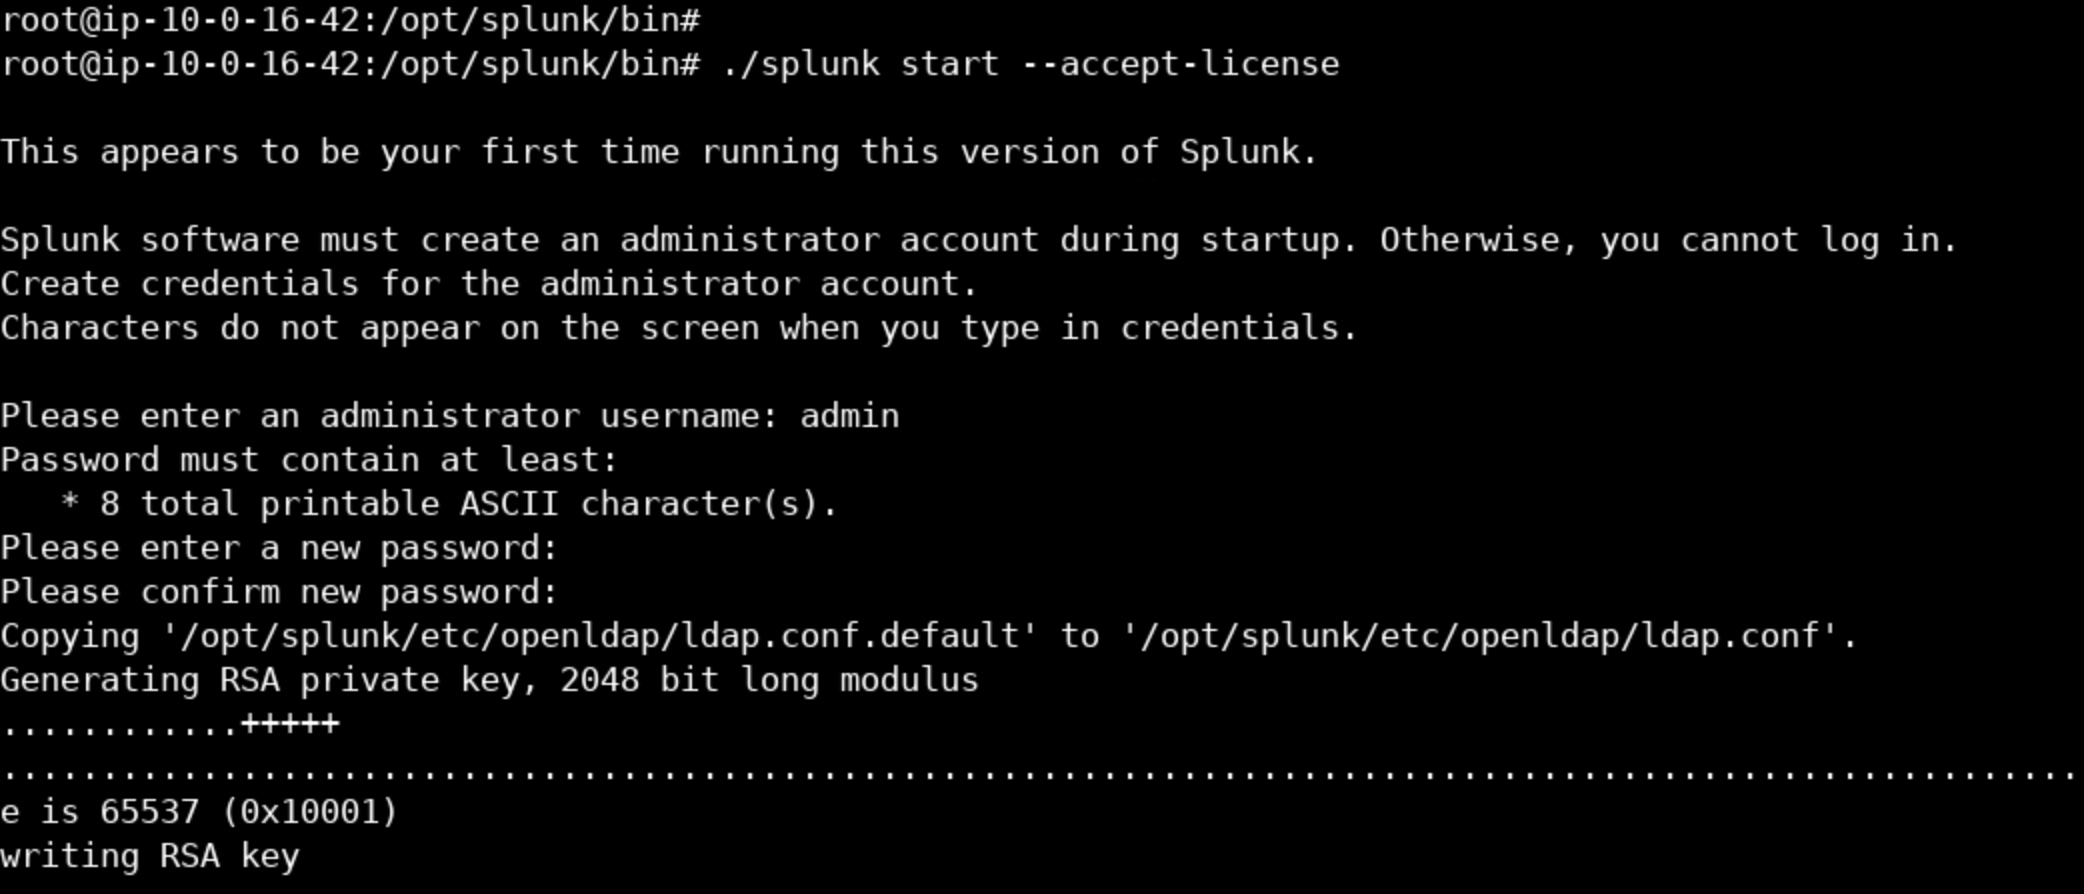
Ignore any error that you might notice. Splunk is now up and running.
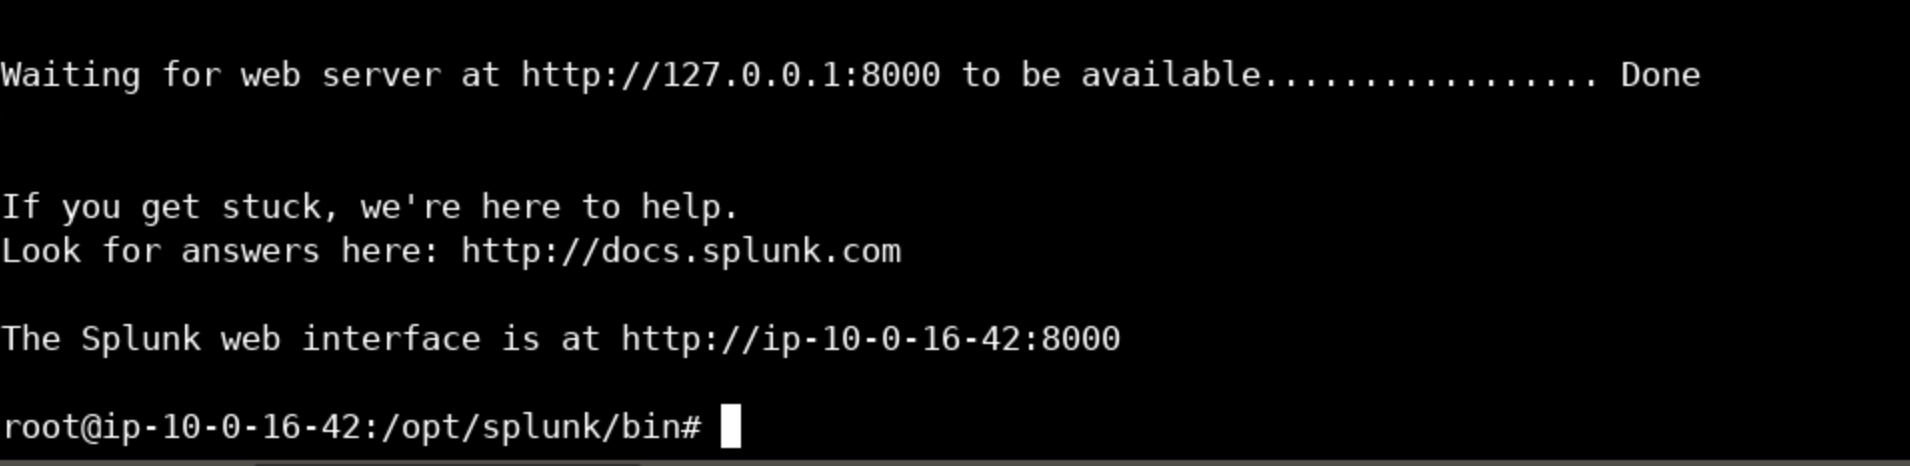
To enable Splunk to start automatically at boot time, you can use the following command:
Command:
./splunk enable boot-start
Step 4: Navigate to the following URL to access Splunk:
http://localhost:8000Use the credentials that you specified before to log in:
- Username: admin
- Password: password
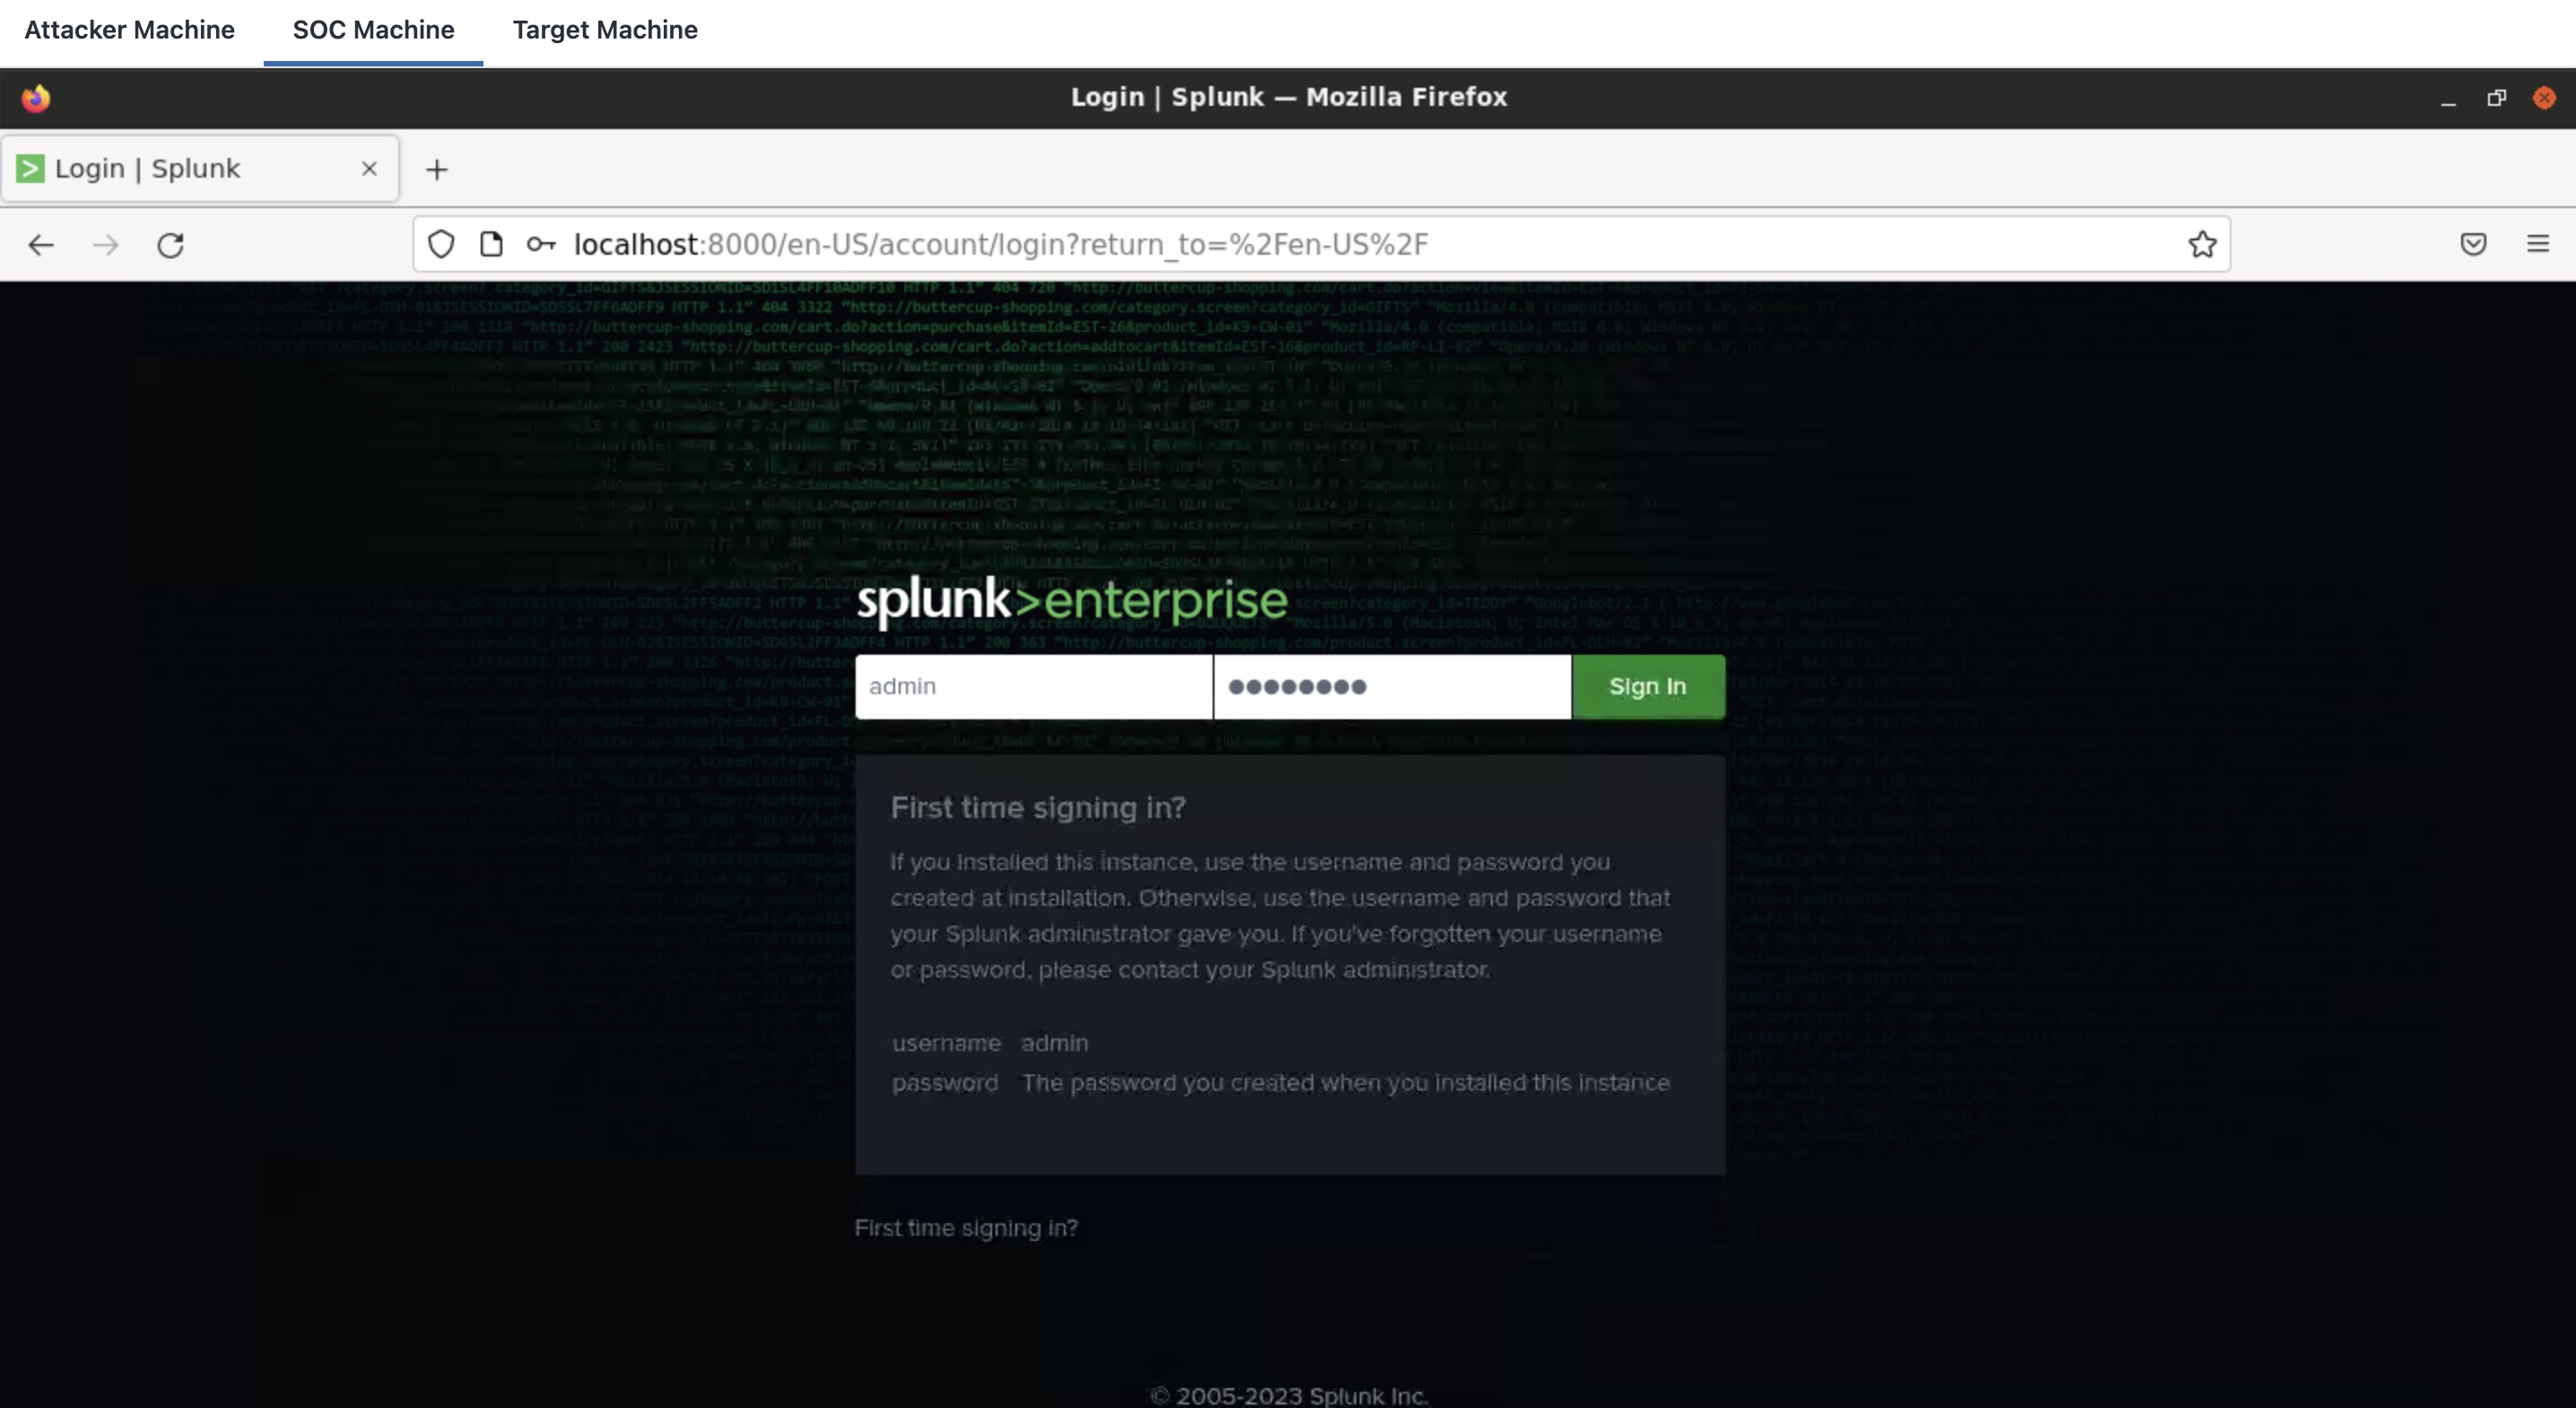
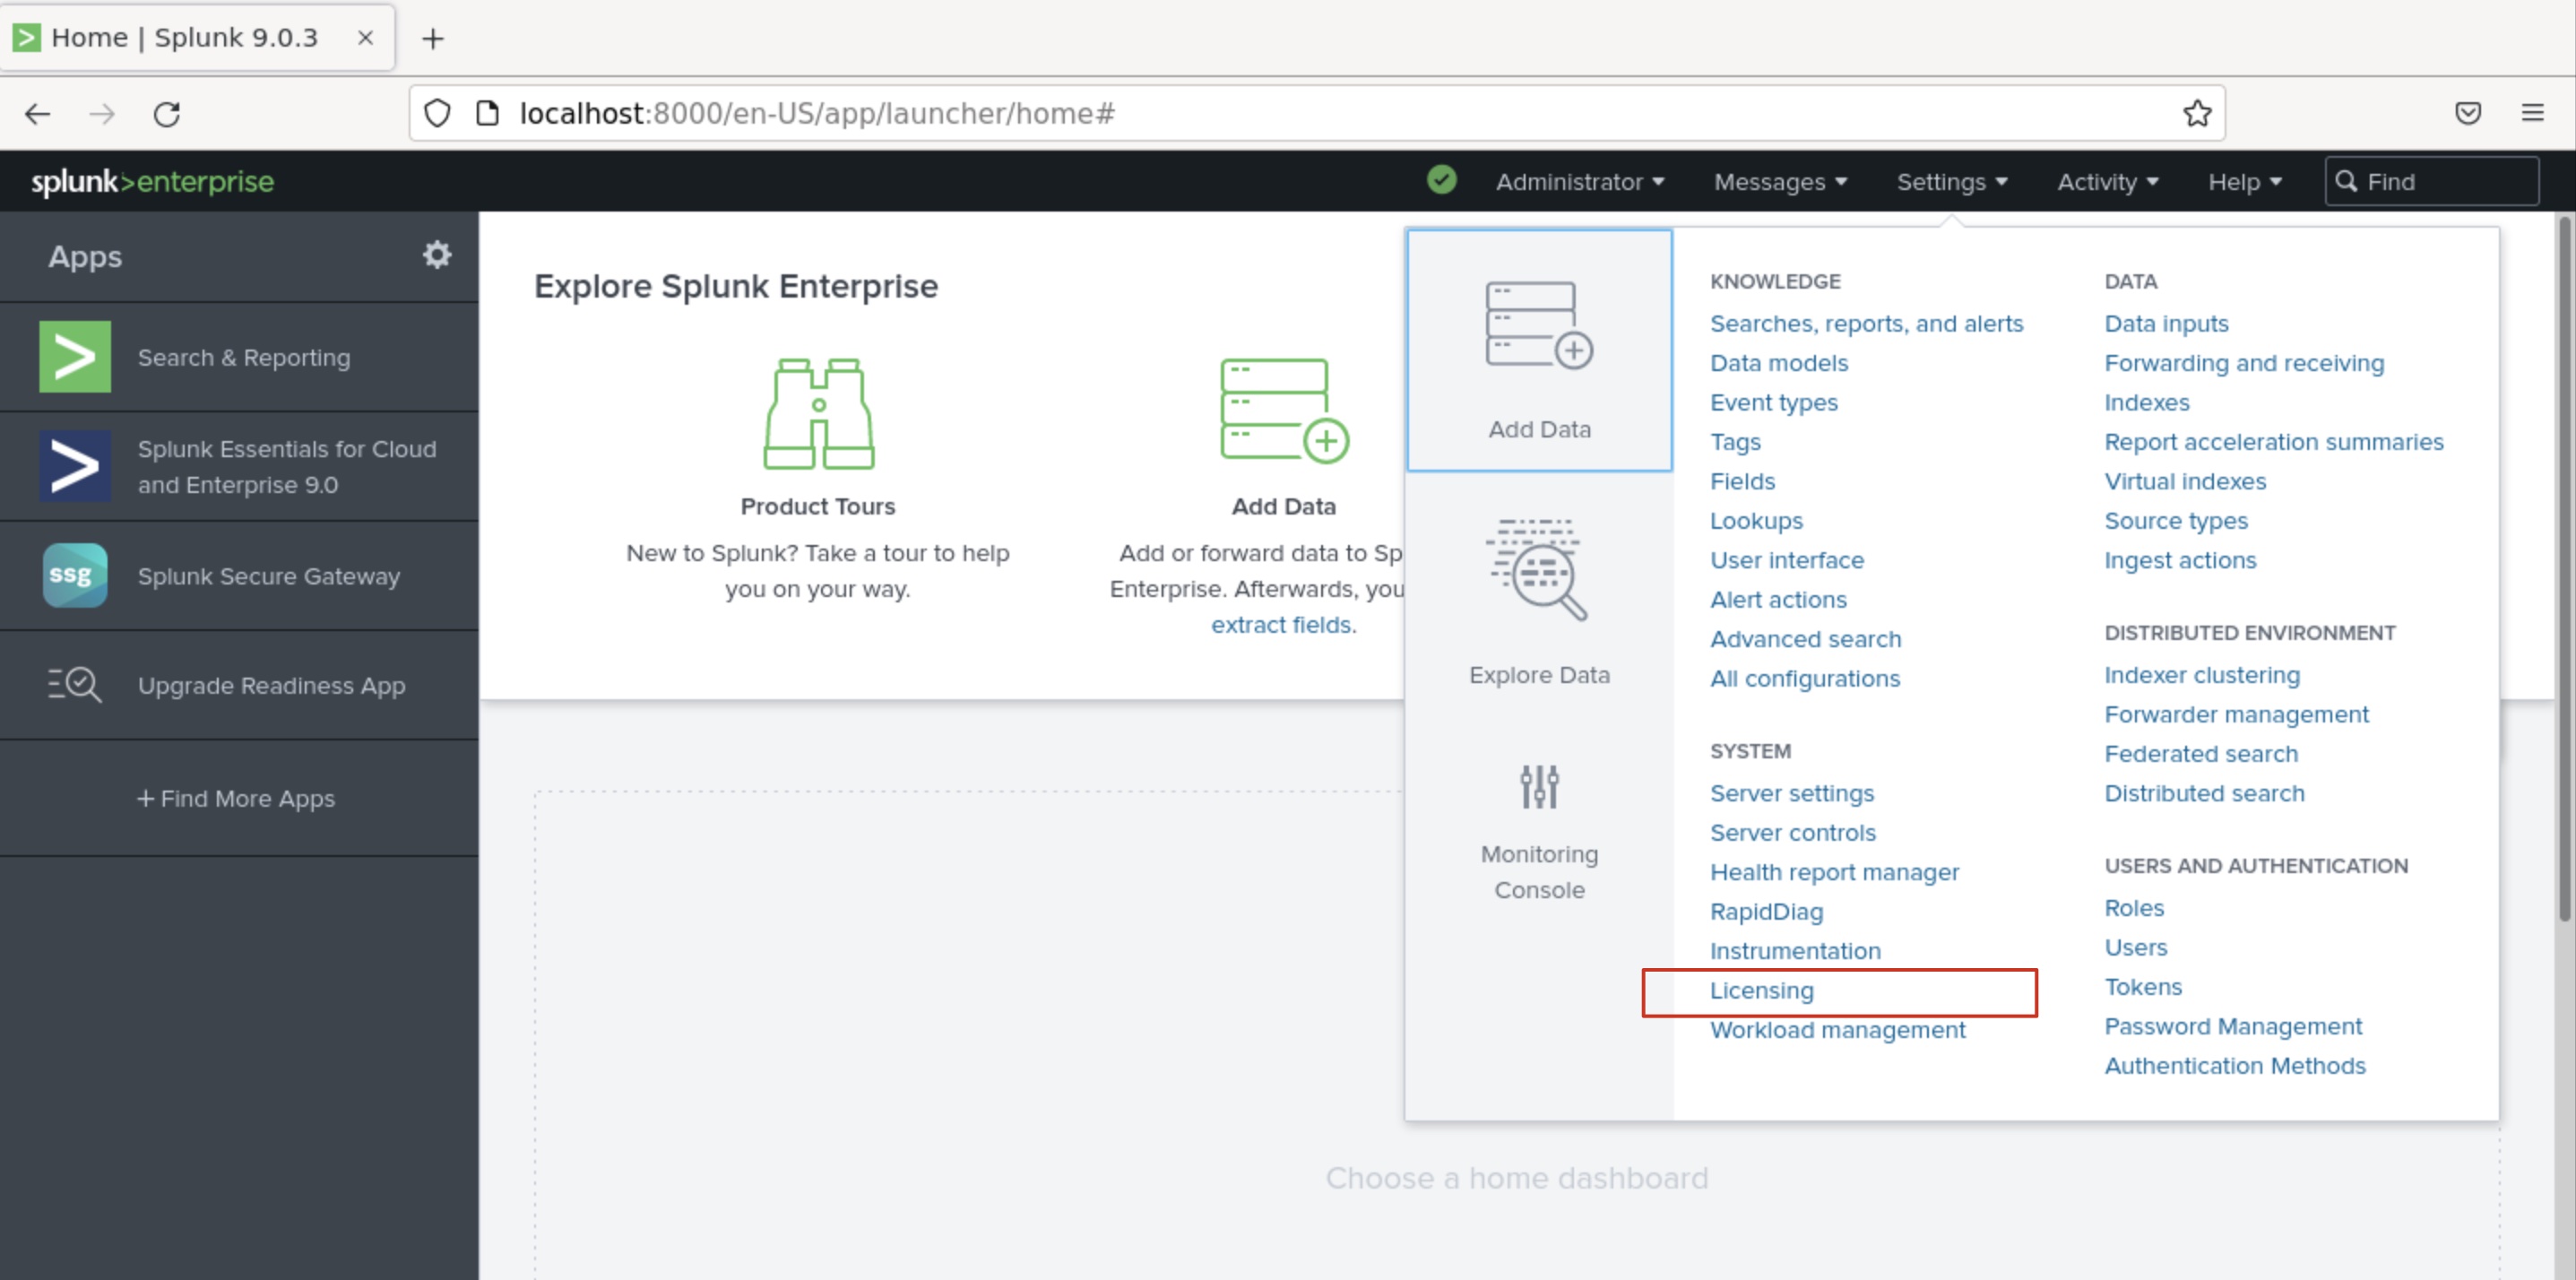
Step 5: Once you are logged in, go to Settings > System > Licensing.
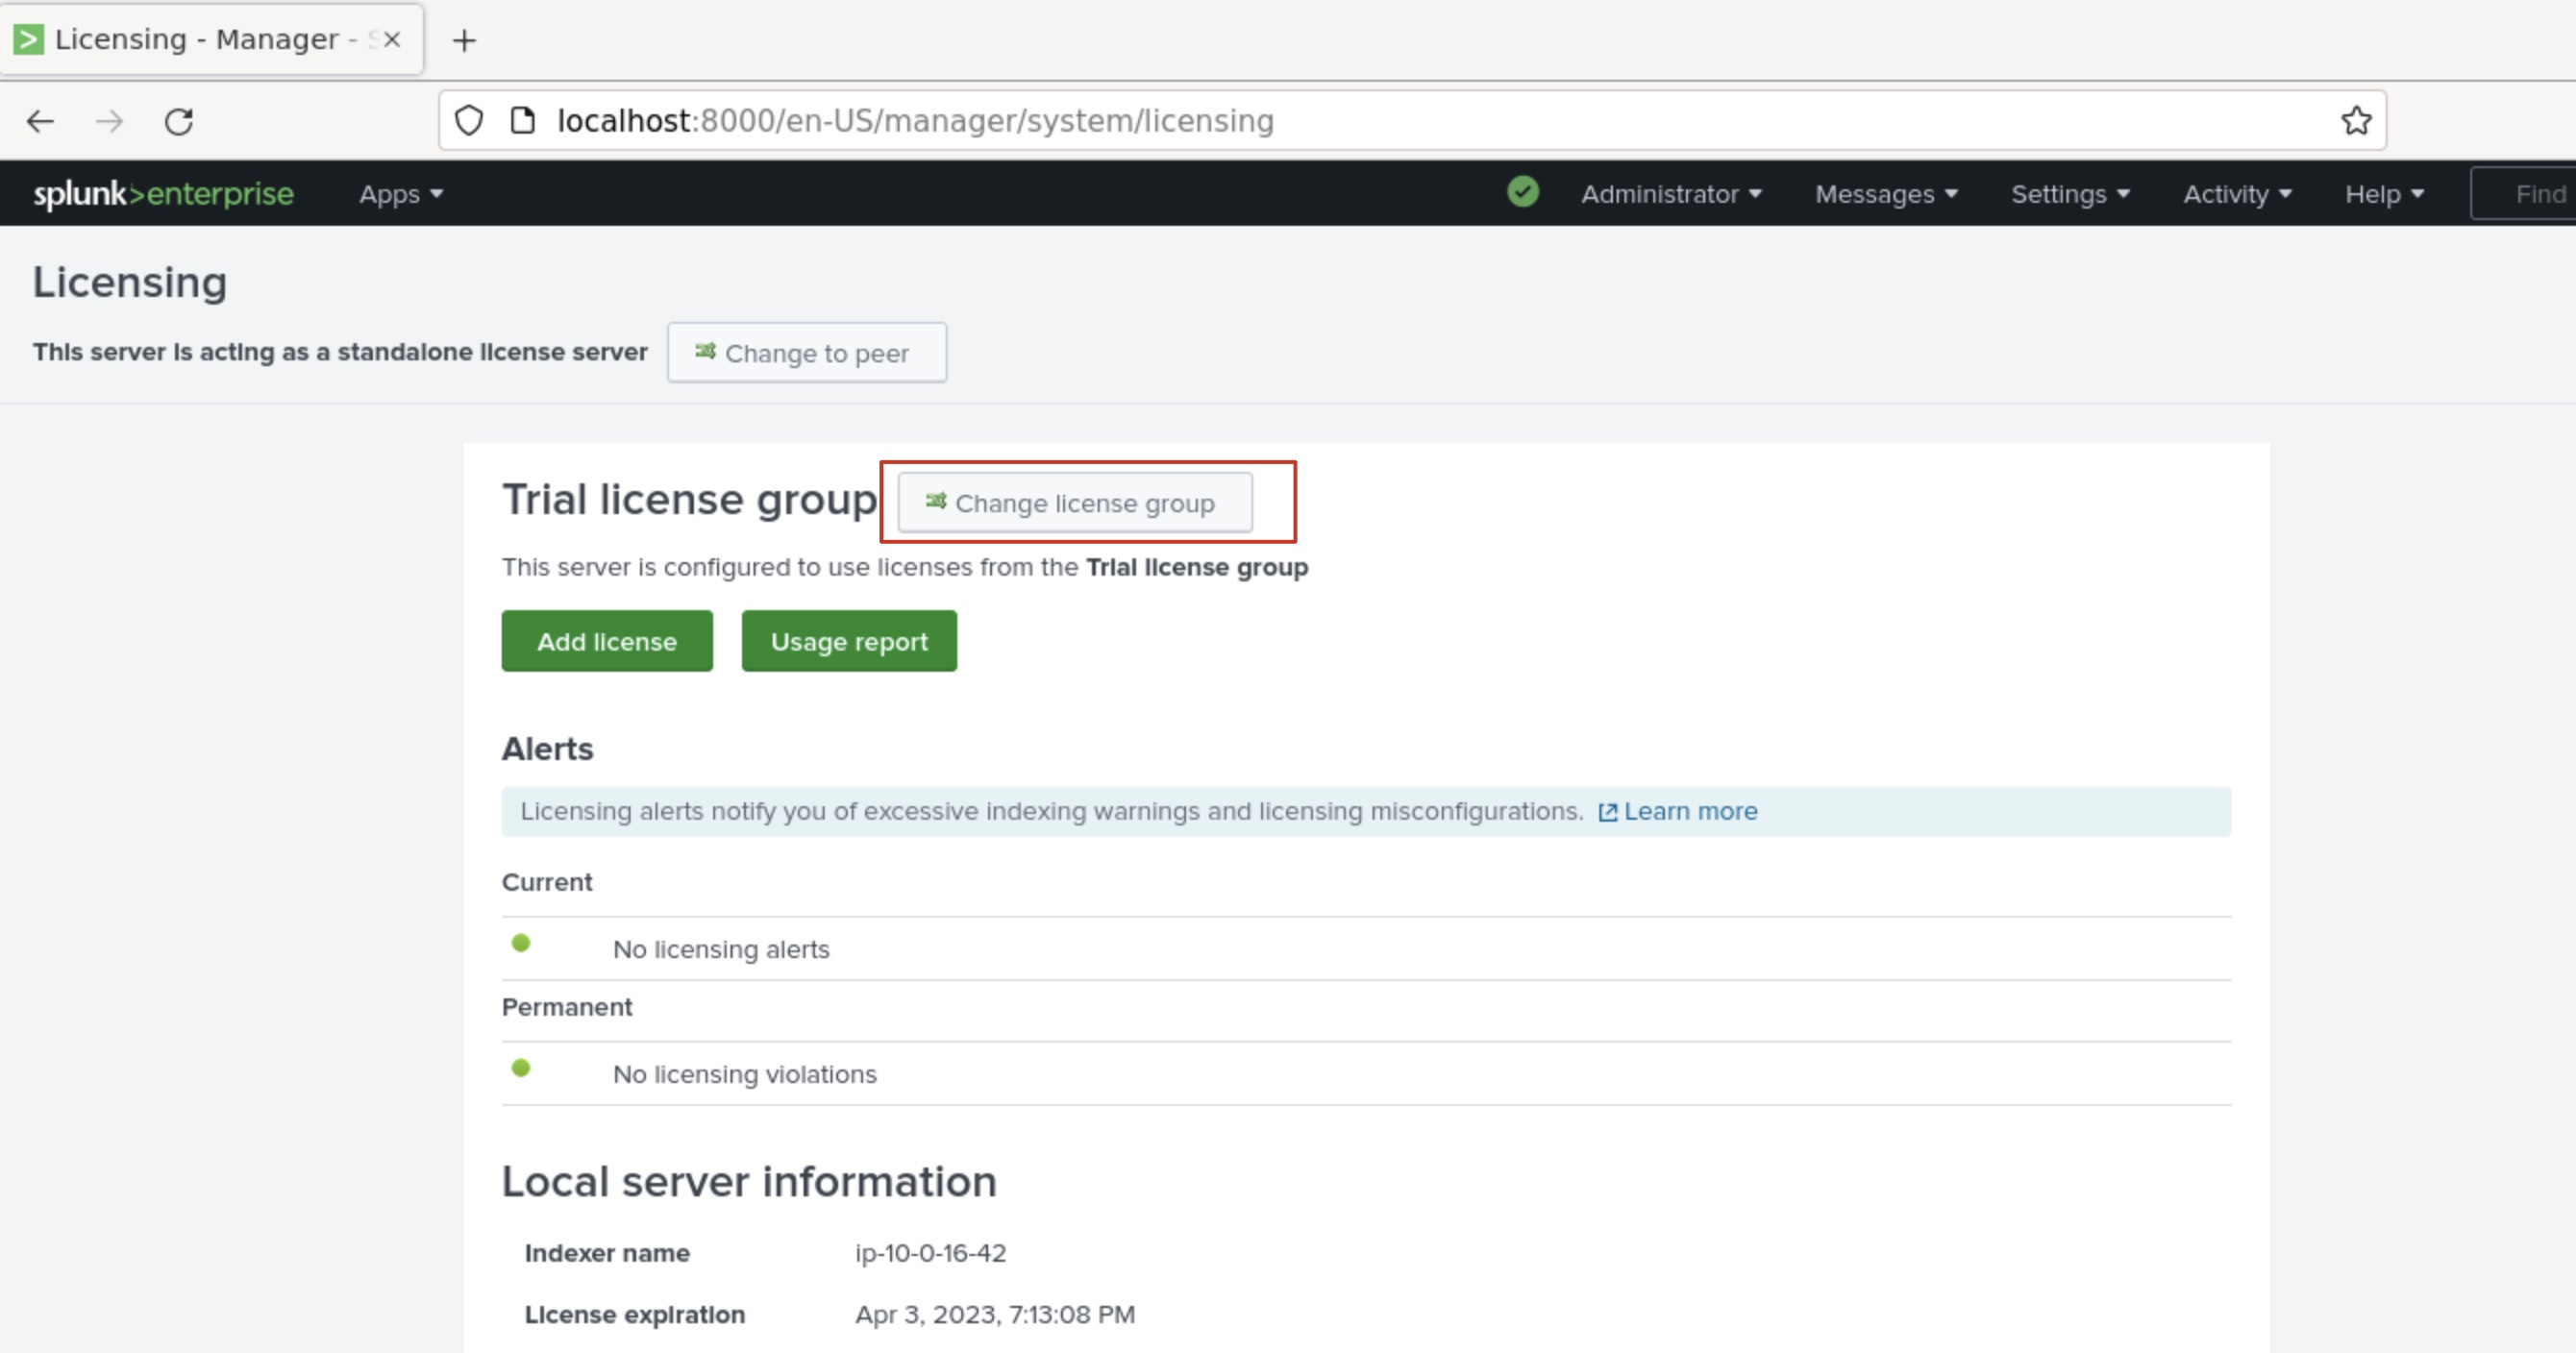
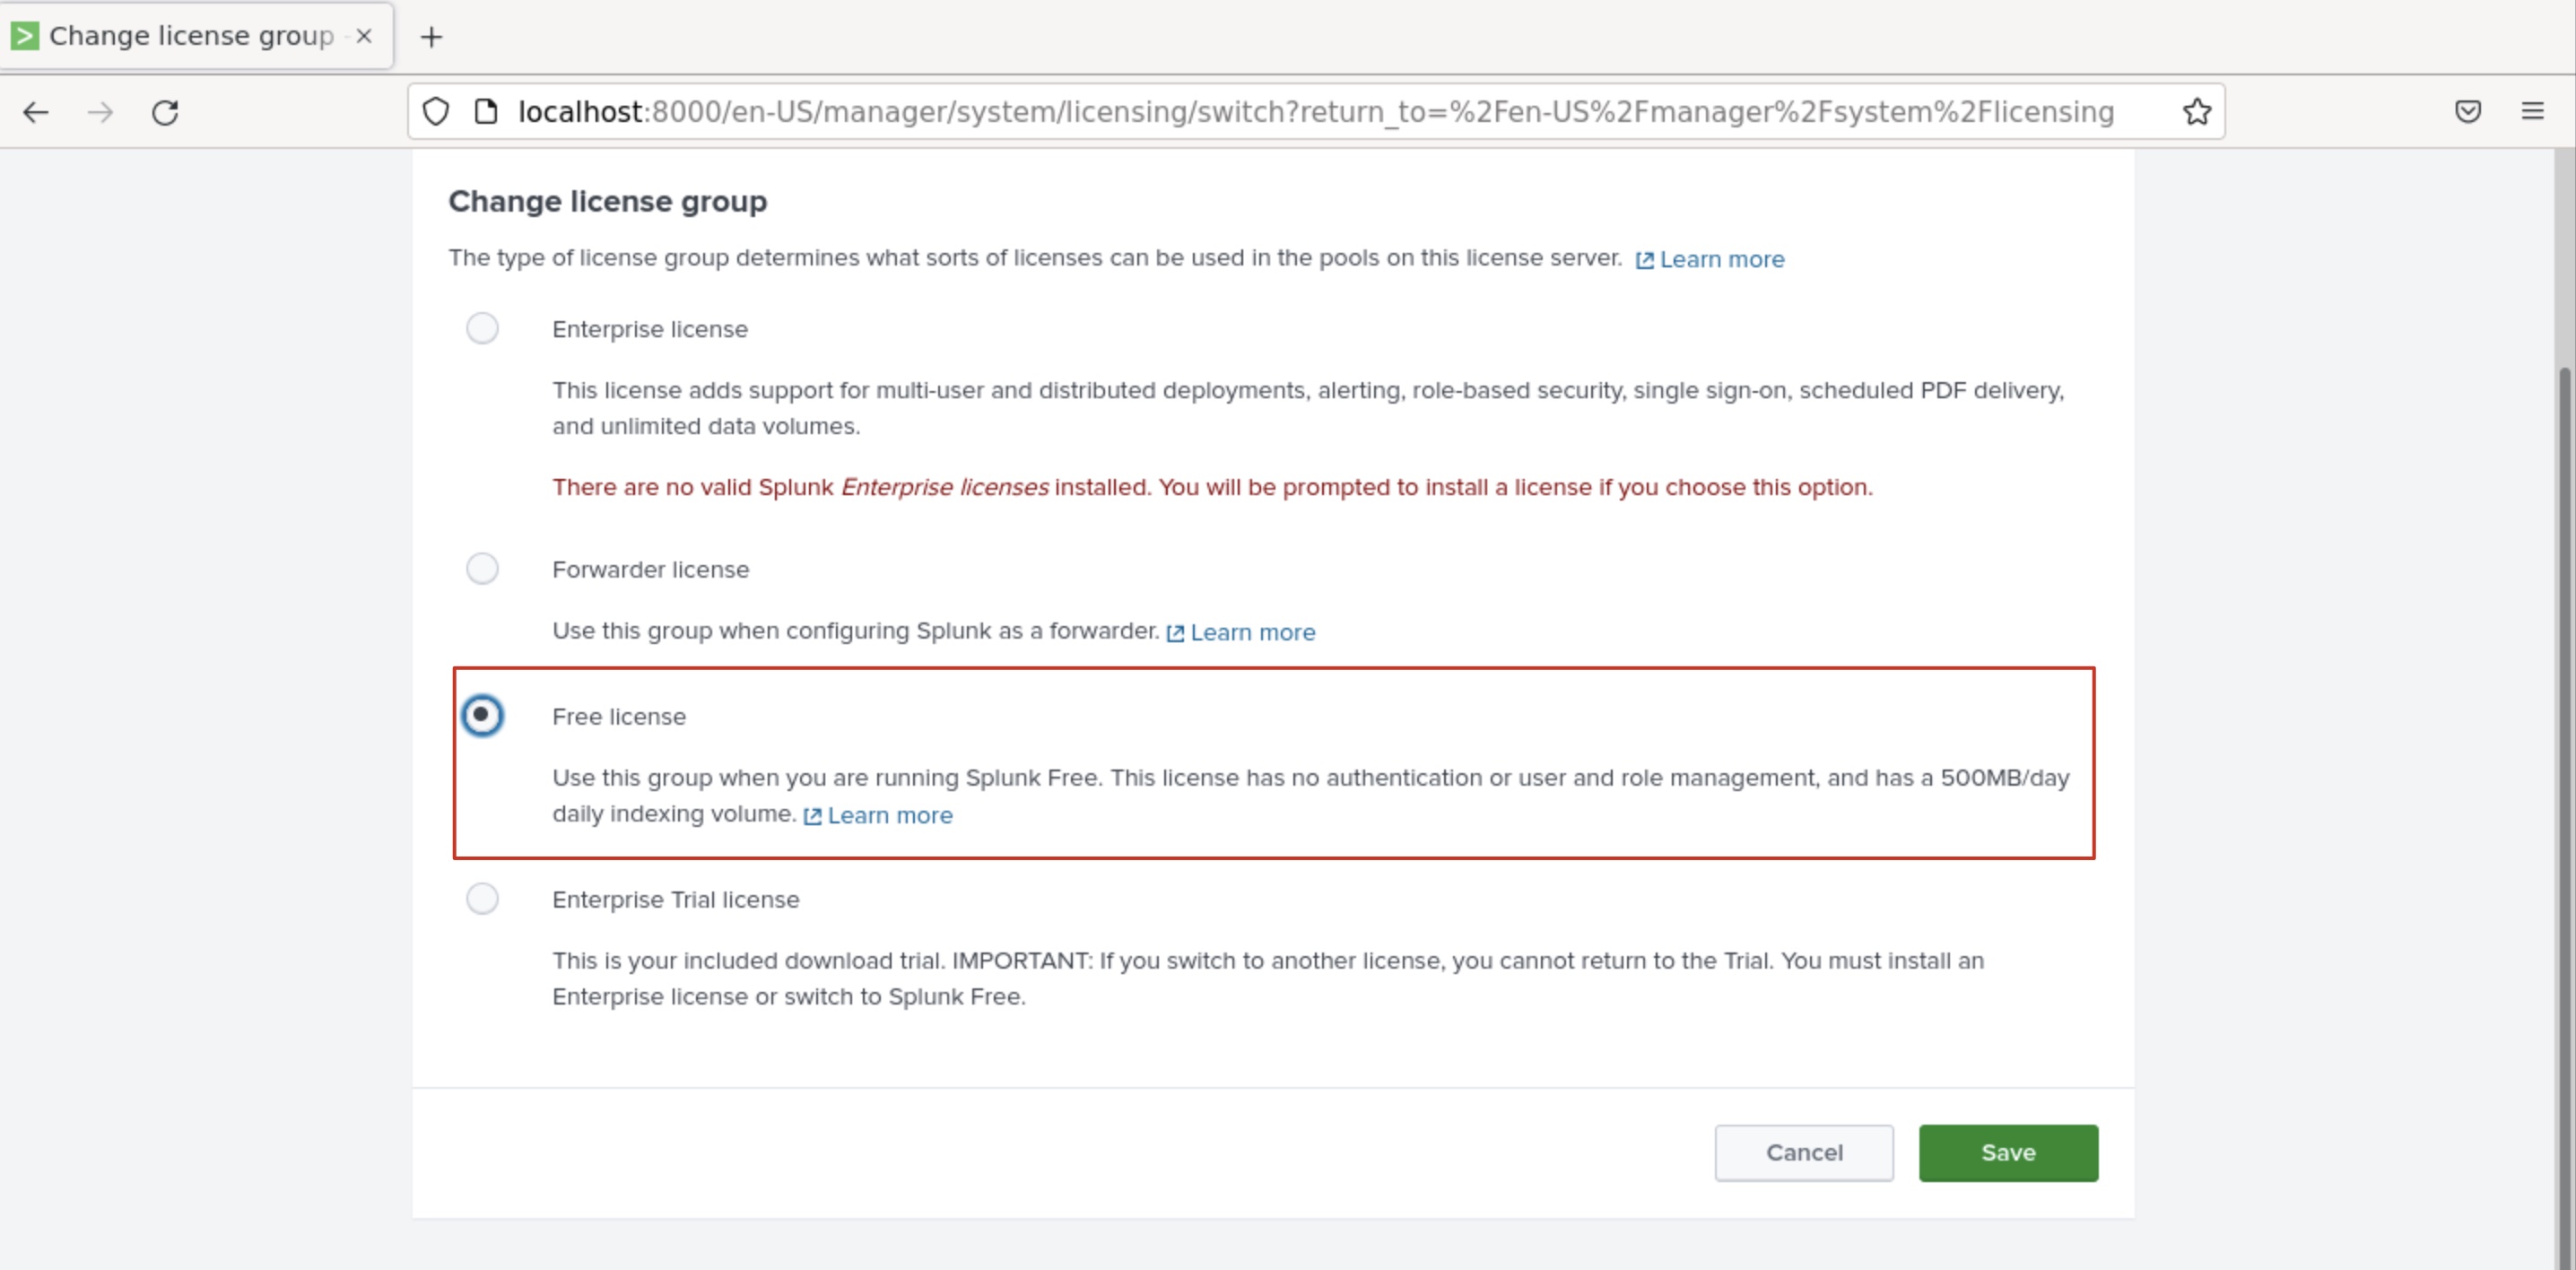
Click on Change license group.
Select Free license from the options given and then click on Save.
Now, you will be asked to restart Splunk in order for changes to take effect. We will restart Splunk from the terminal itself. Close the current tab. On the terminal, while you are at the /opt/splunk/bin directory, run the following command to restart Splunk:
Command:
./splunk restart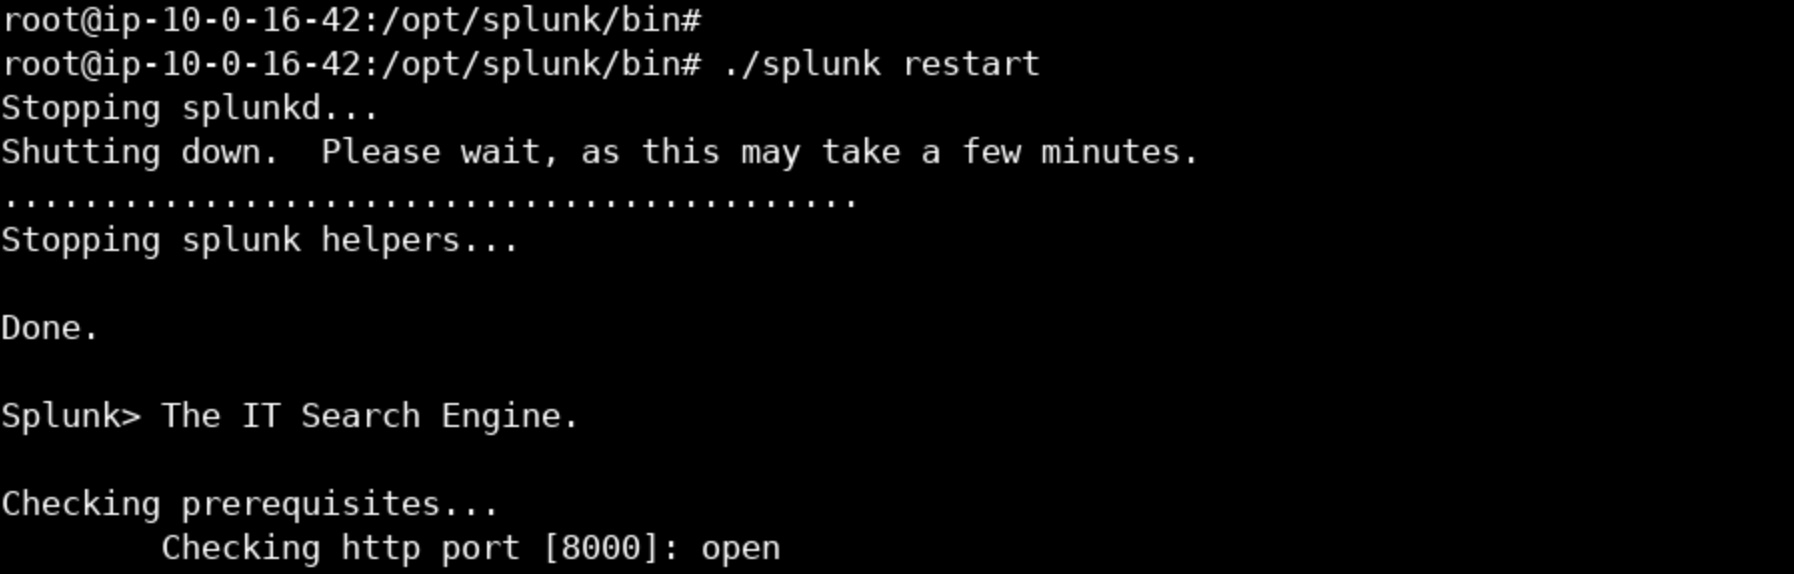
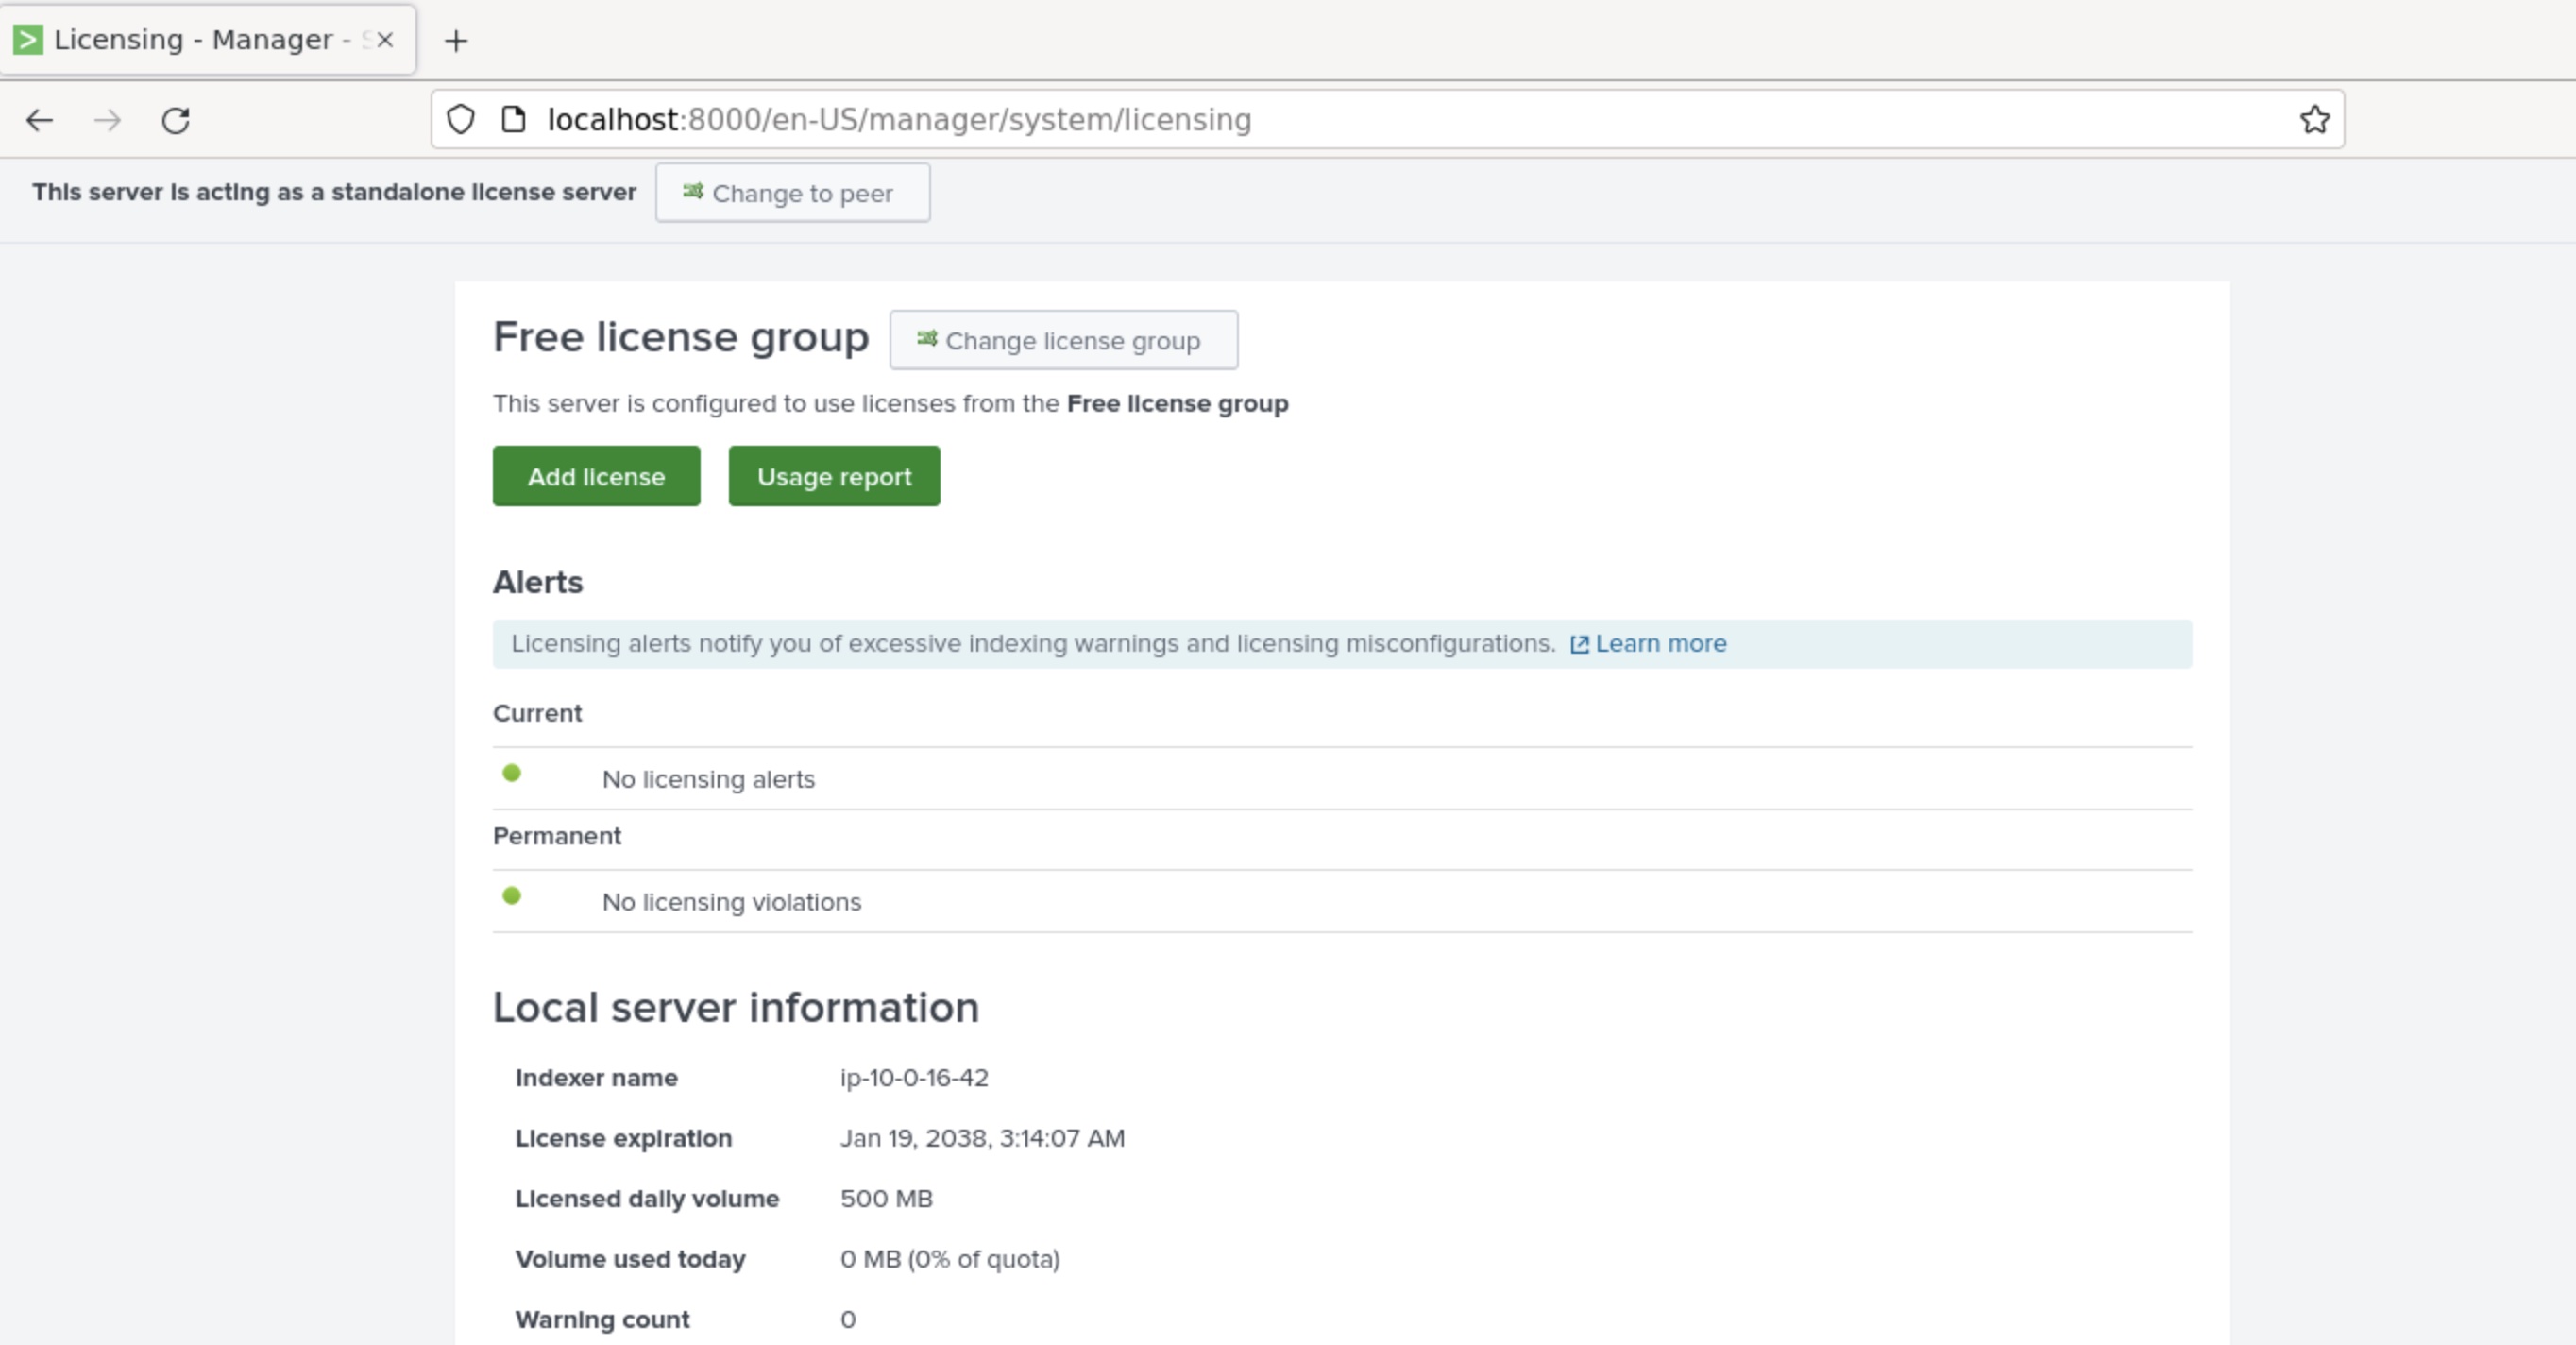
Step 6: After Splunk has been restarted, access it again at http://localhost:8000. This time you will not be asked for credentials. You can navigate to Settings > System > Licensing again to verify that you are now on free license. You can also see the daily volume limit here.
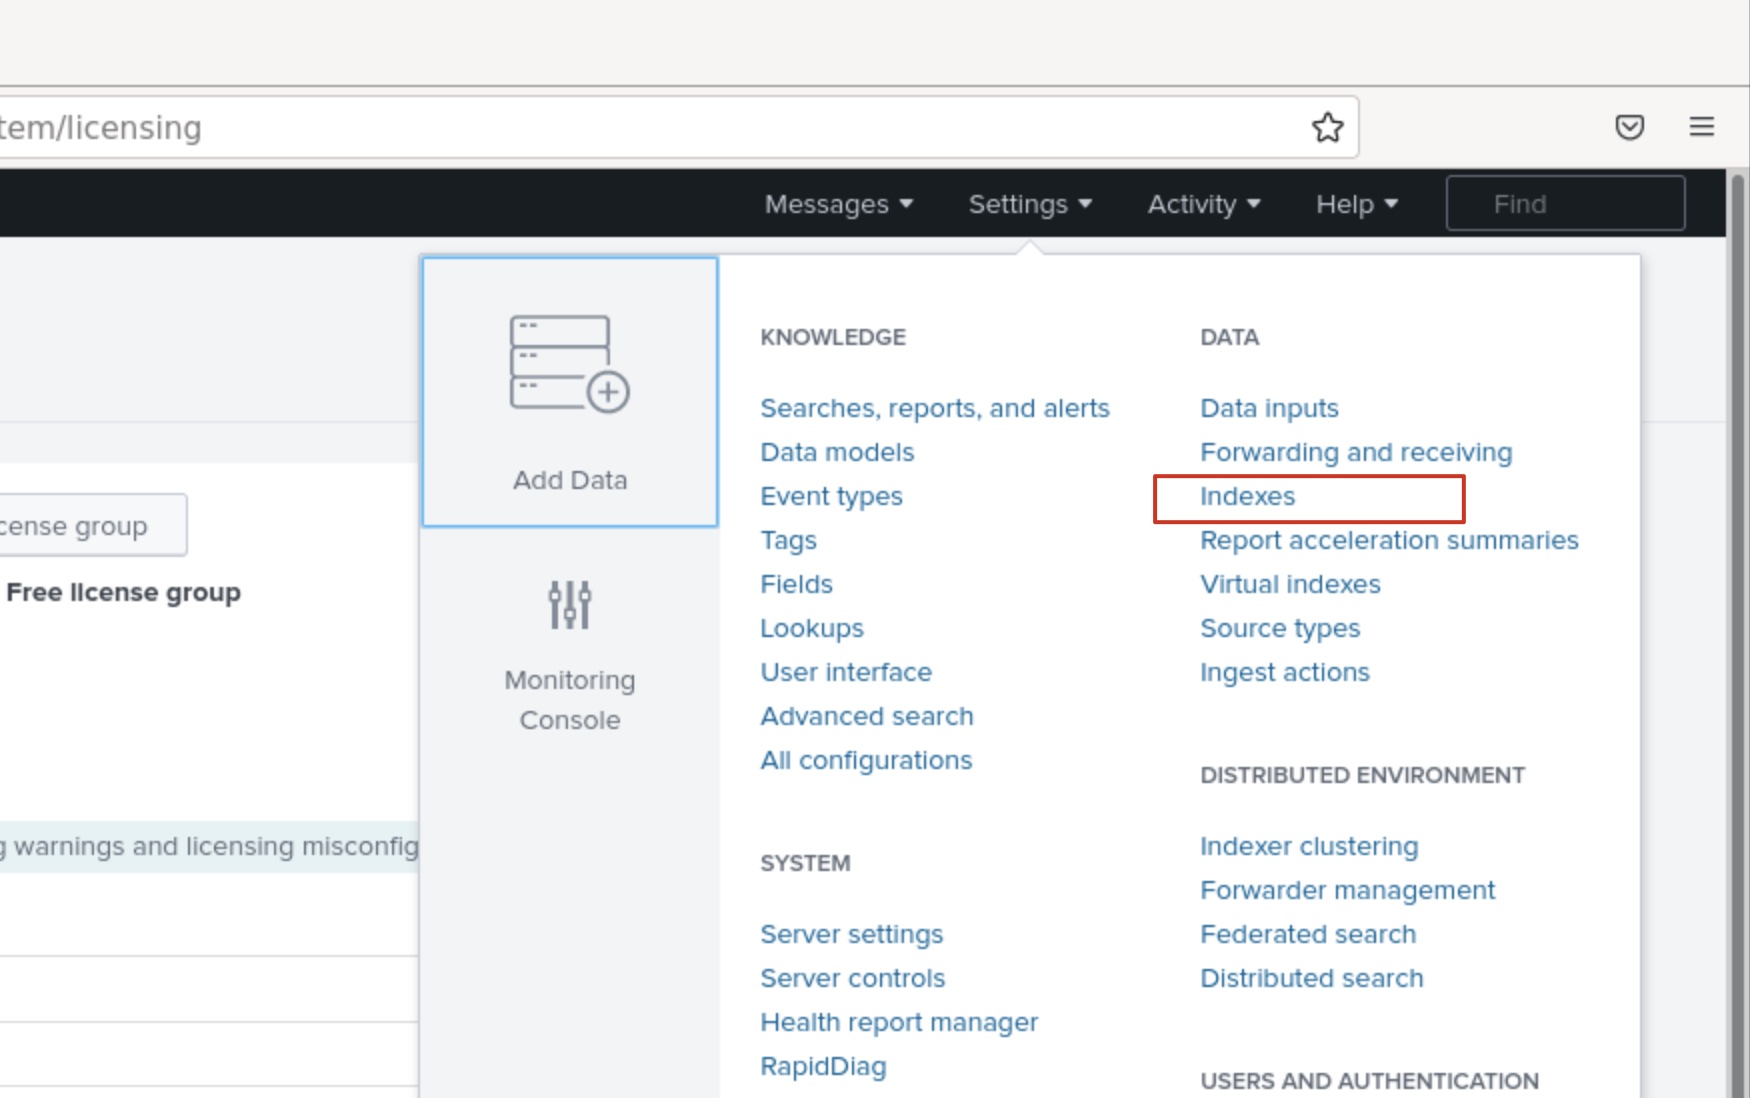
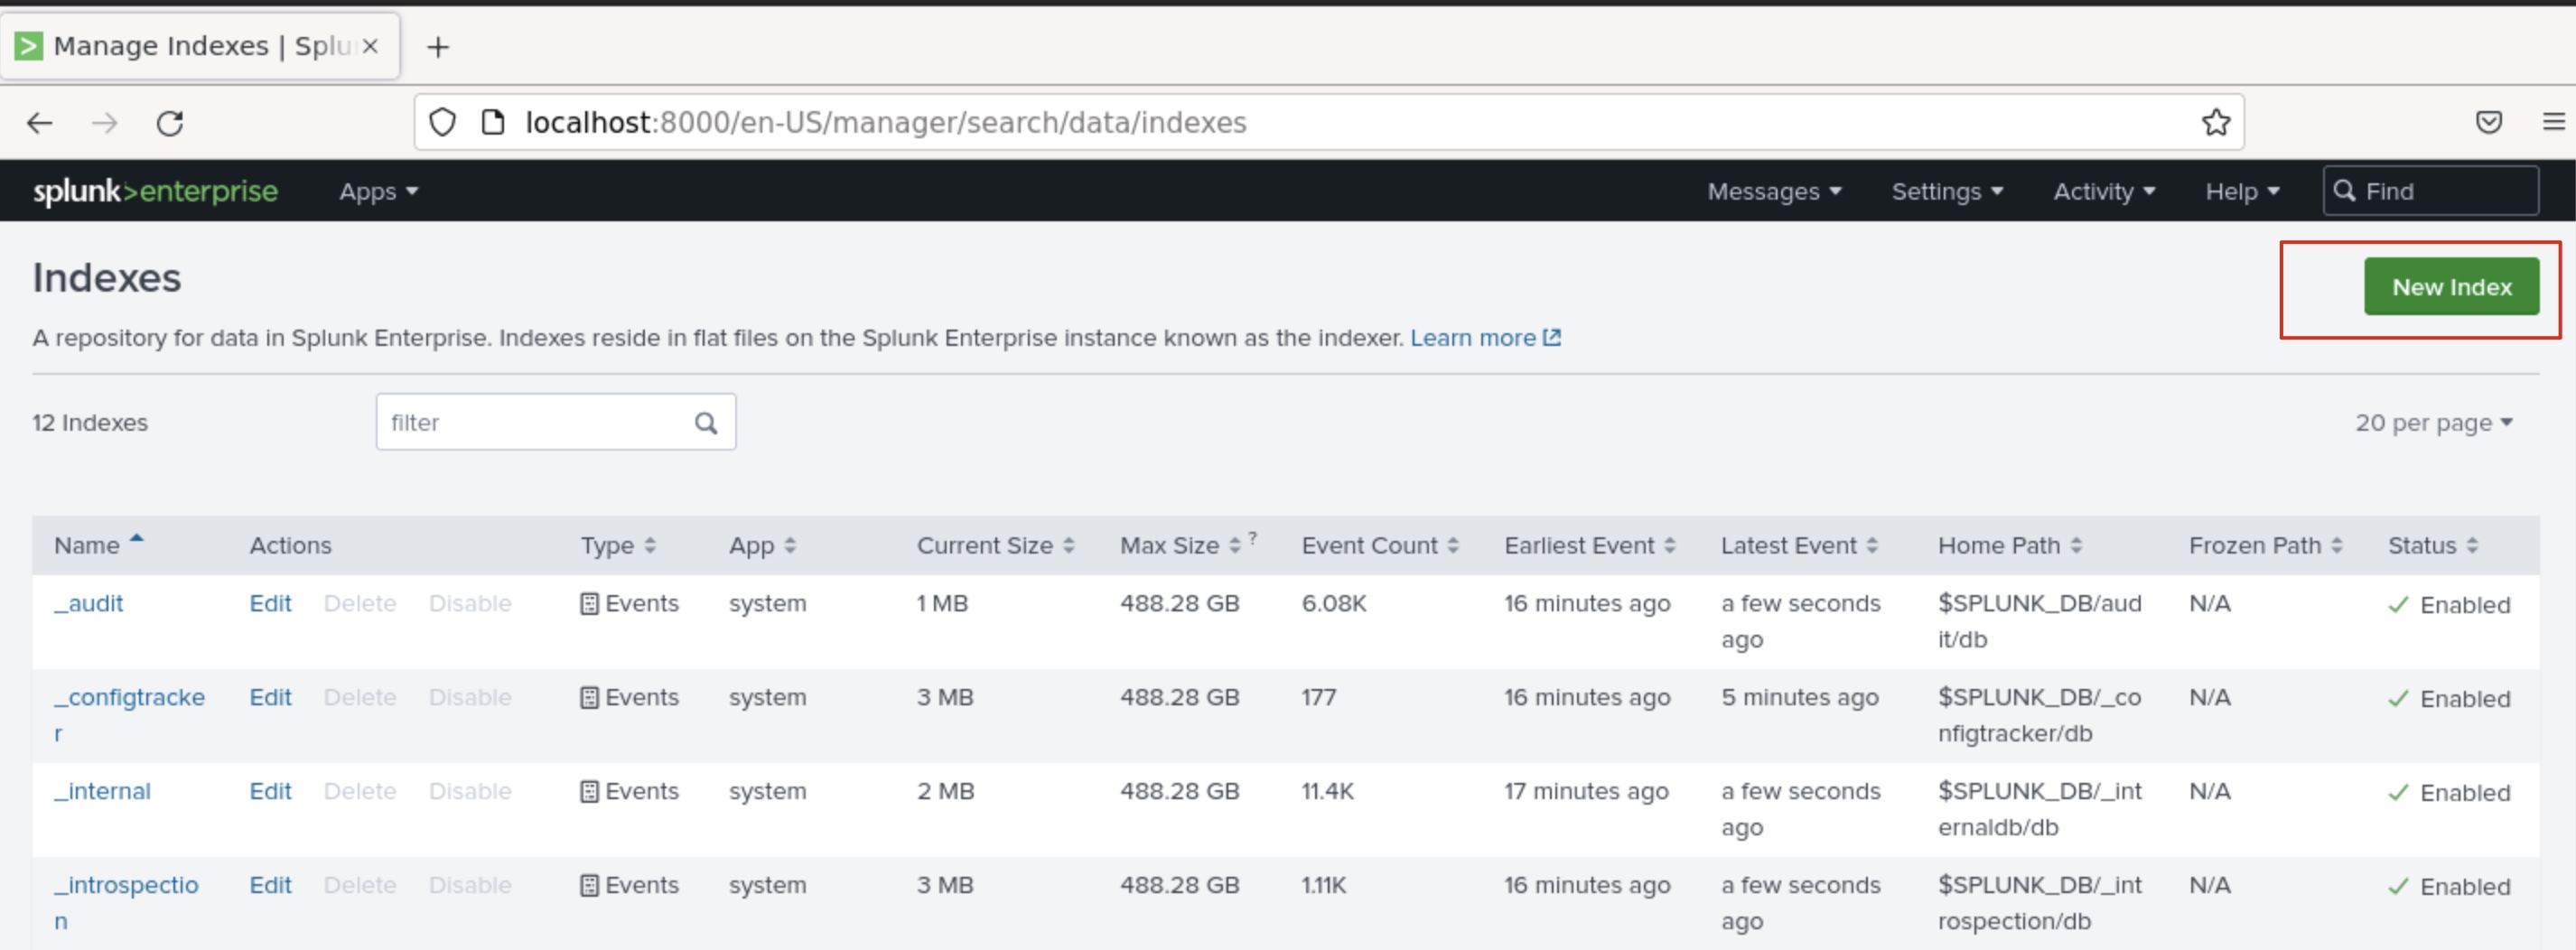
Step 7: Next, create Splunk index for Sysmon. For this, go to Settings > Data > Indexes.
Click on New Index.
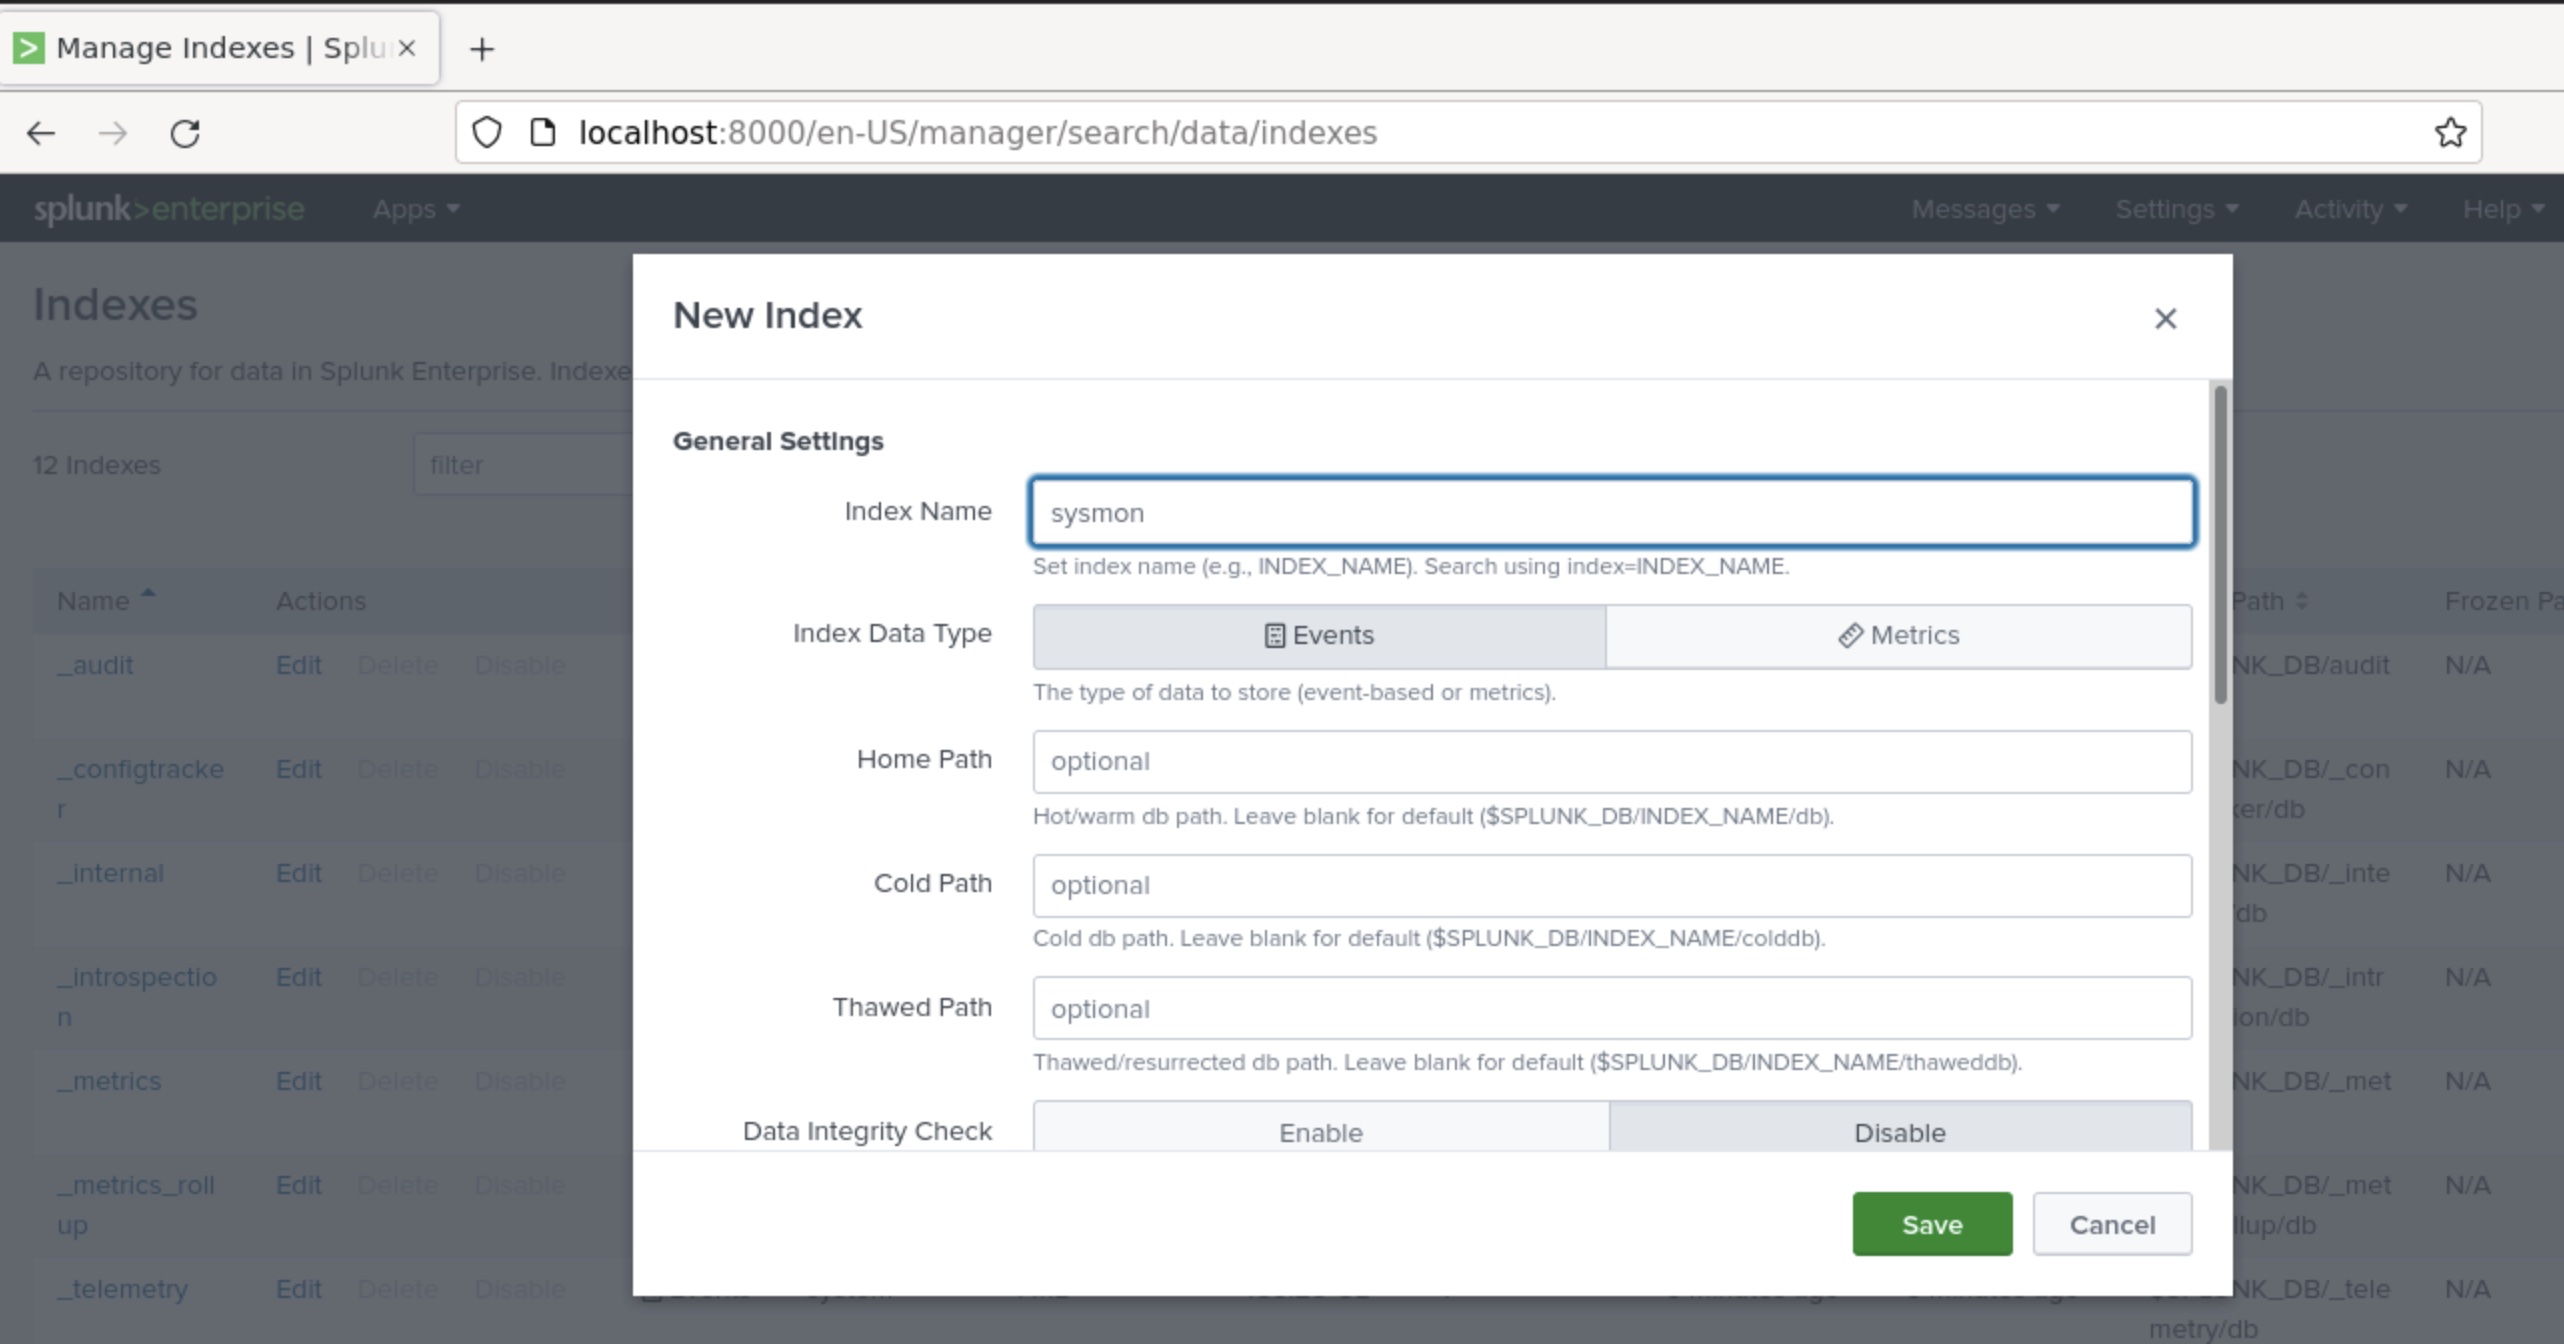
Enter sysmon as Index Name and then directly click on Save.
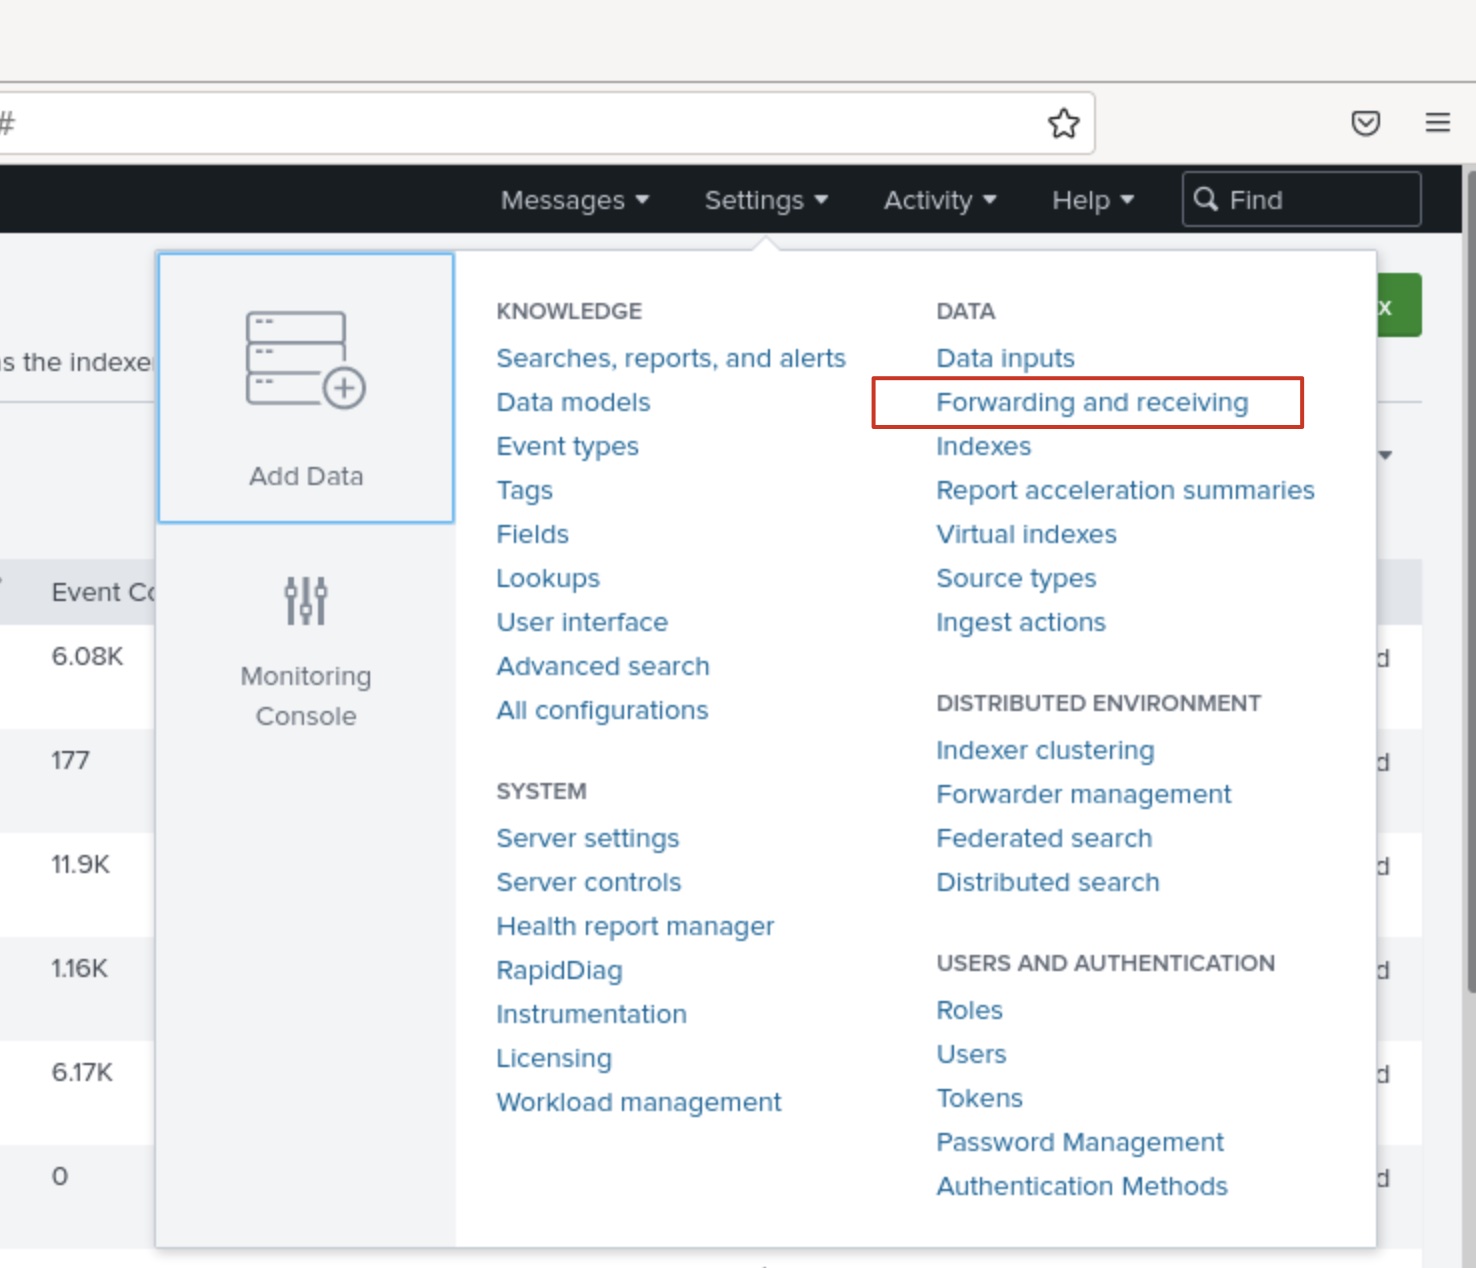
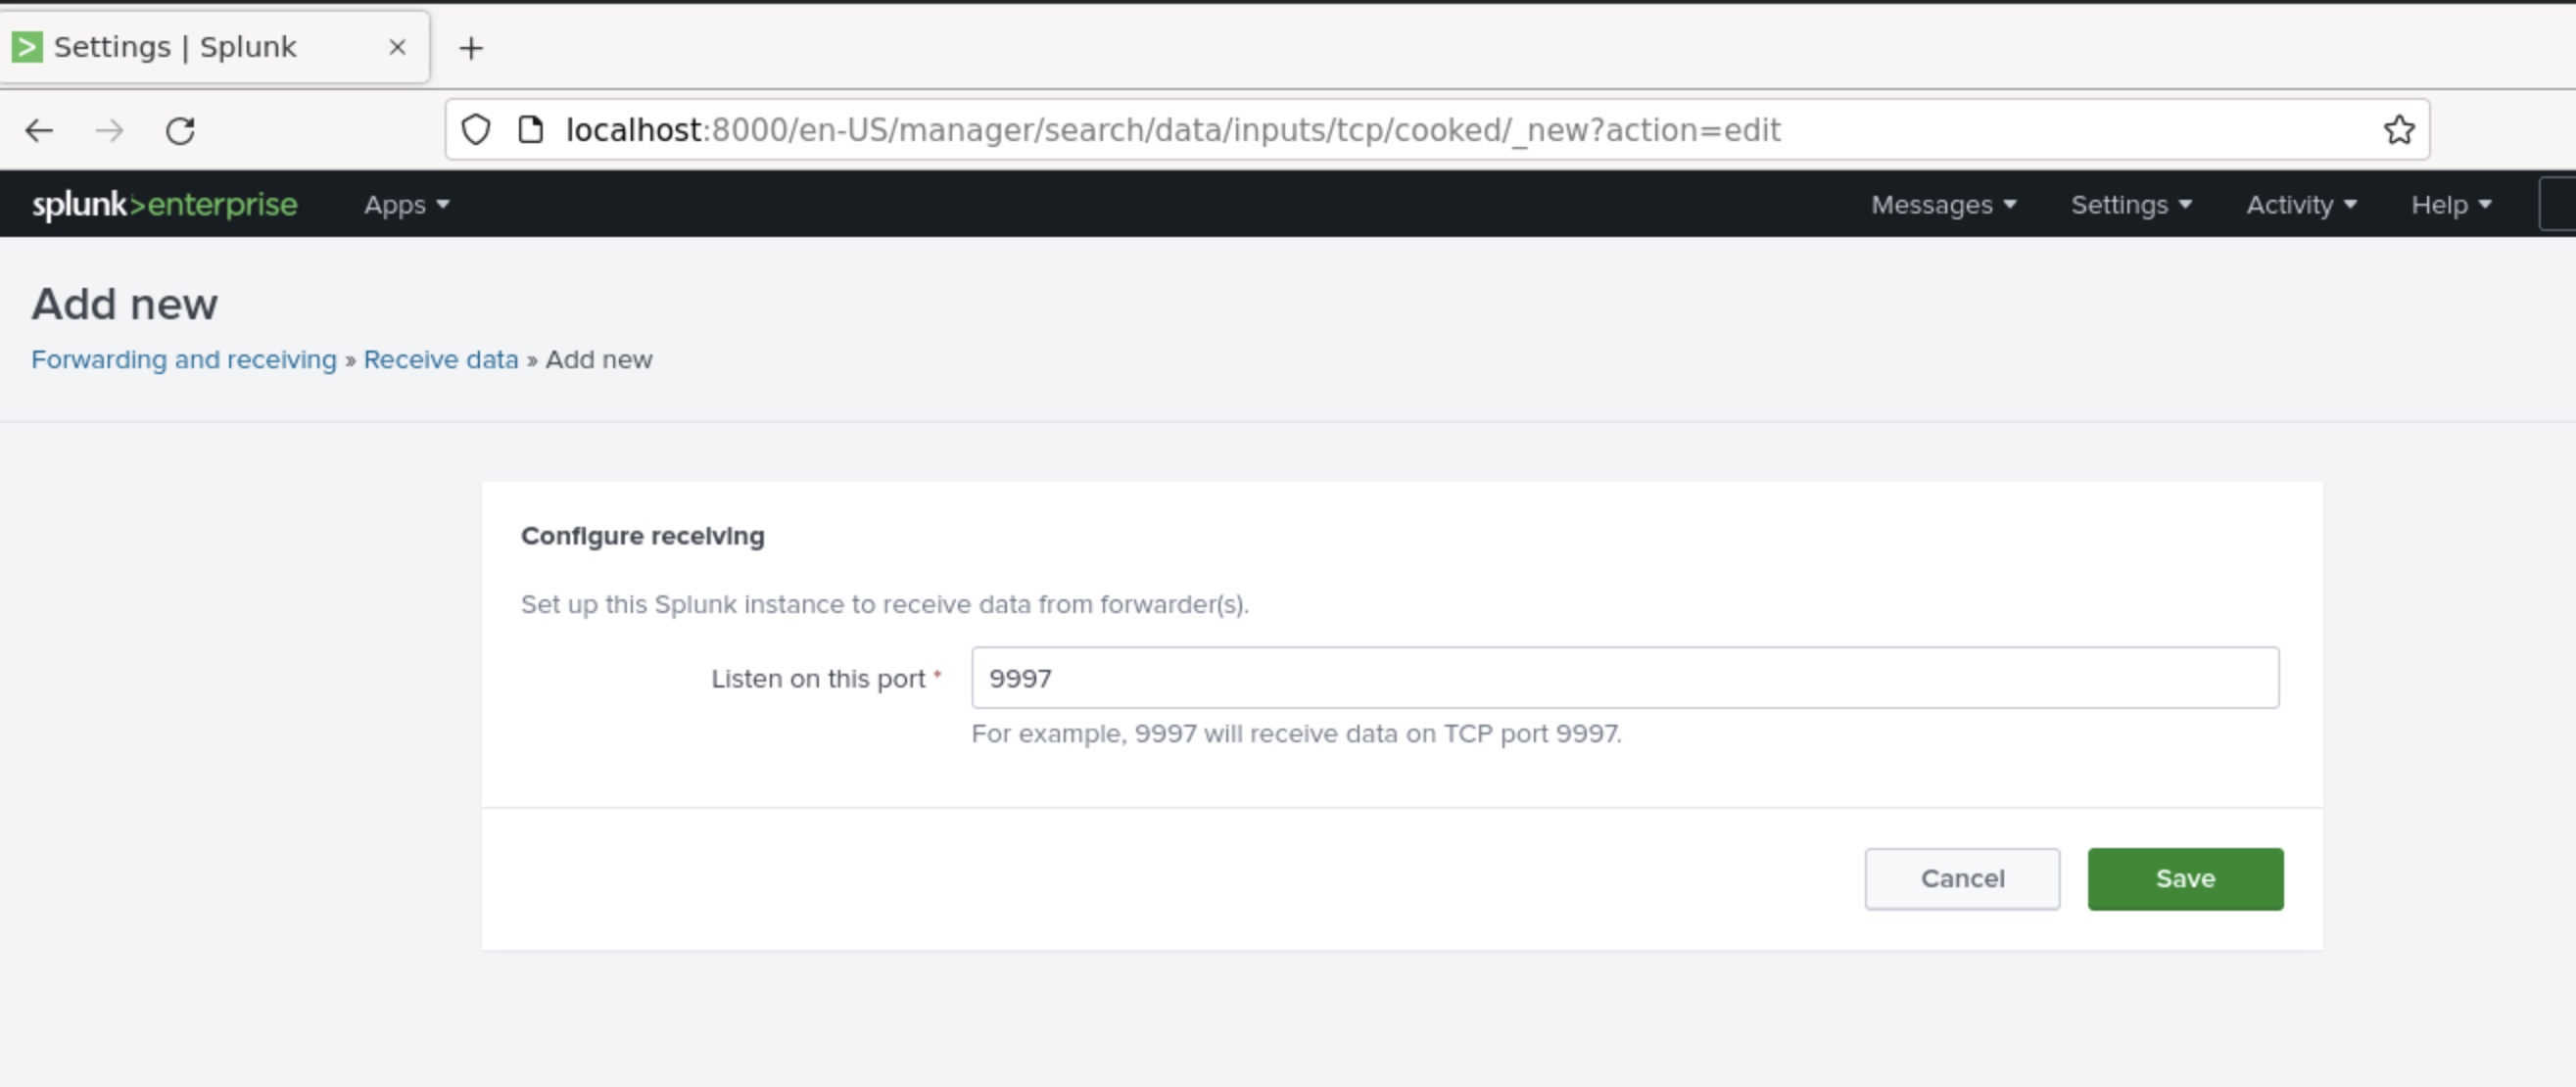
Step 8: Next, enable Splunk universal forwarding logging. For this, go to Settings > Data > Forwarding and receiving.
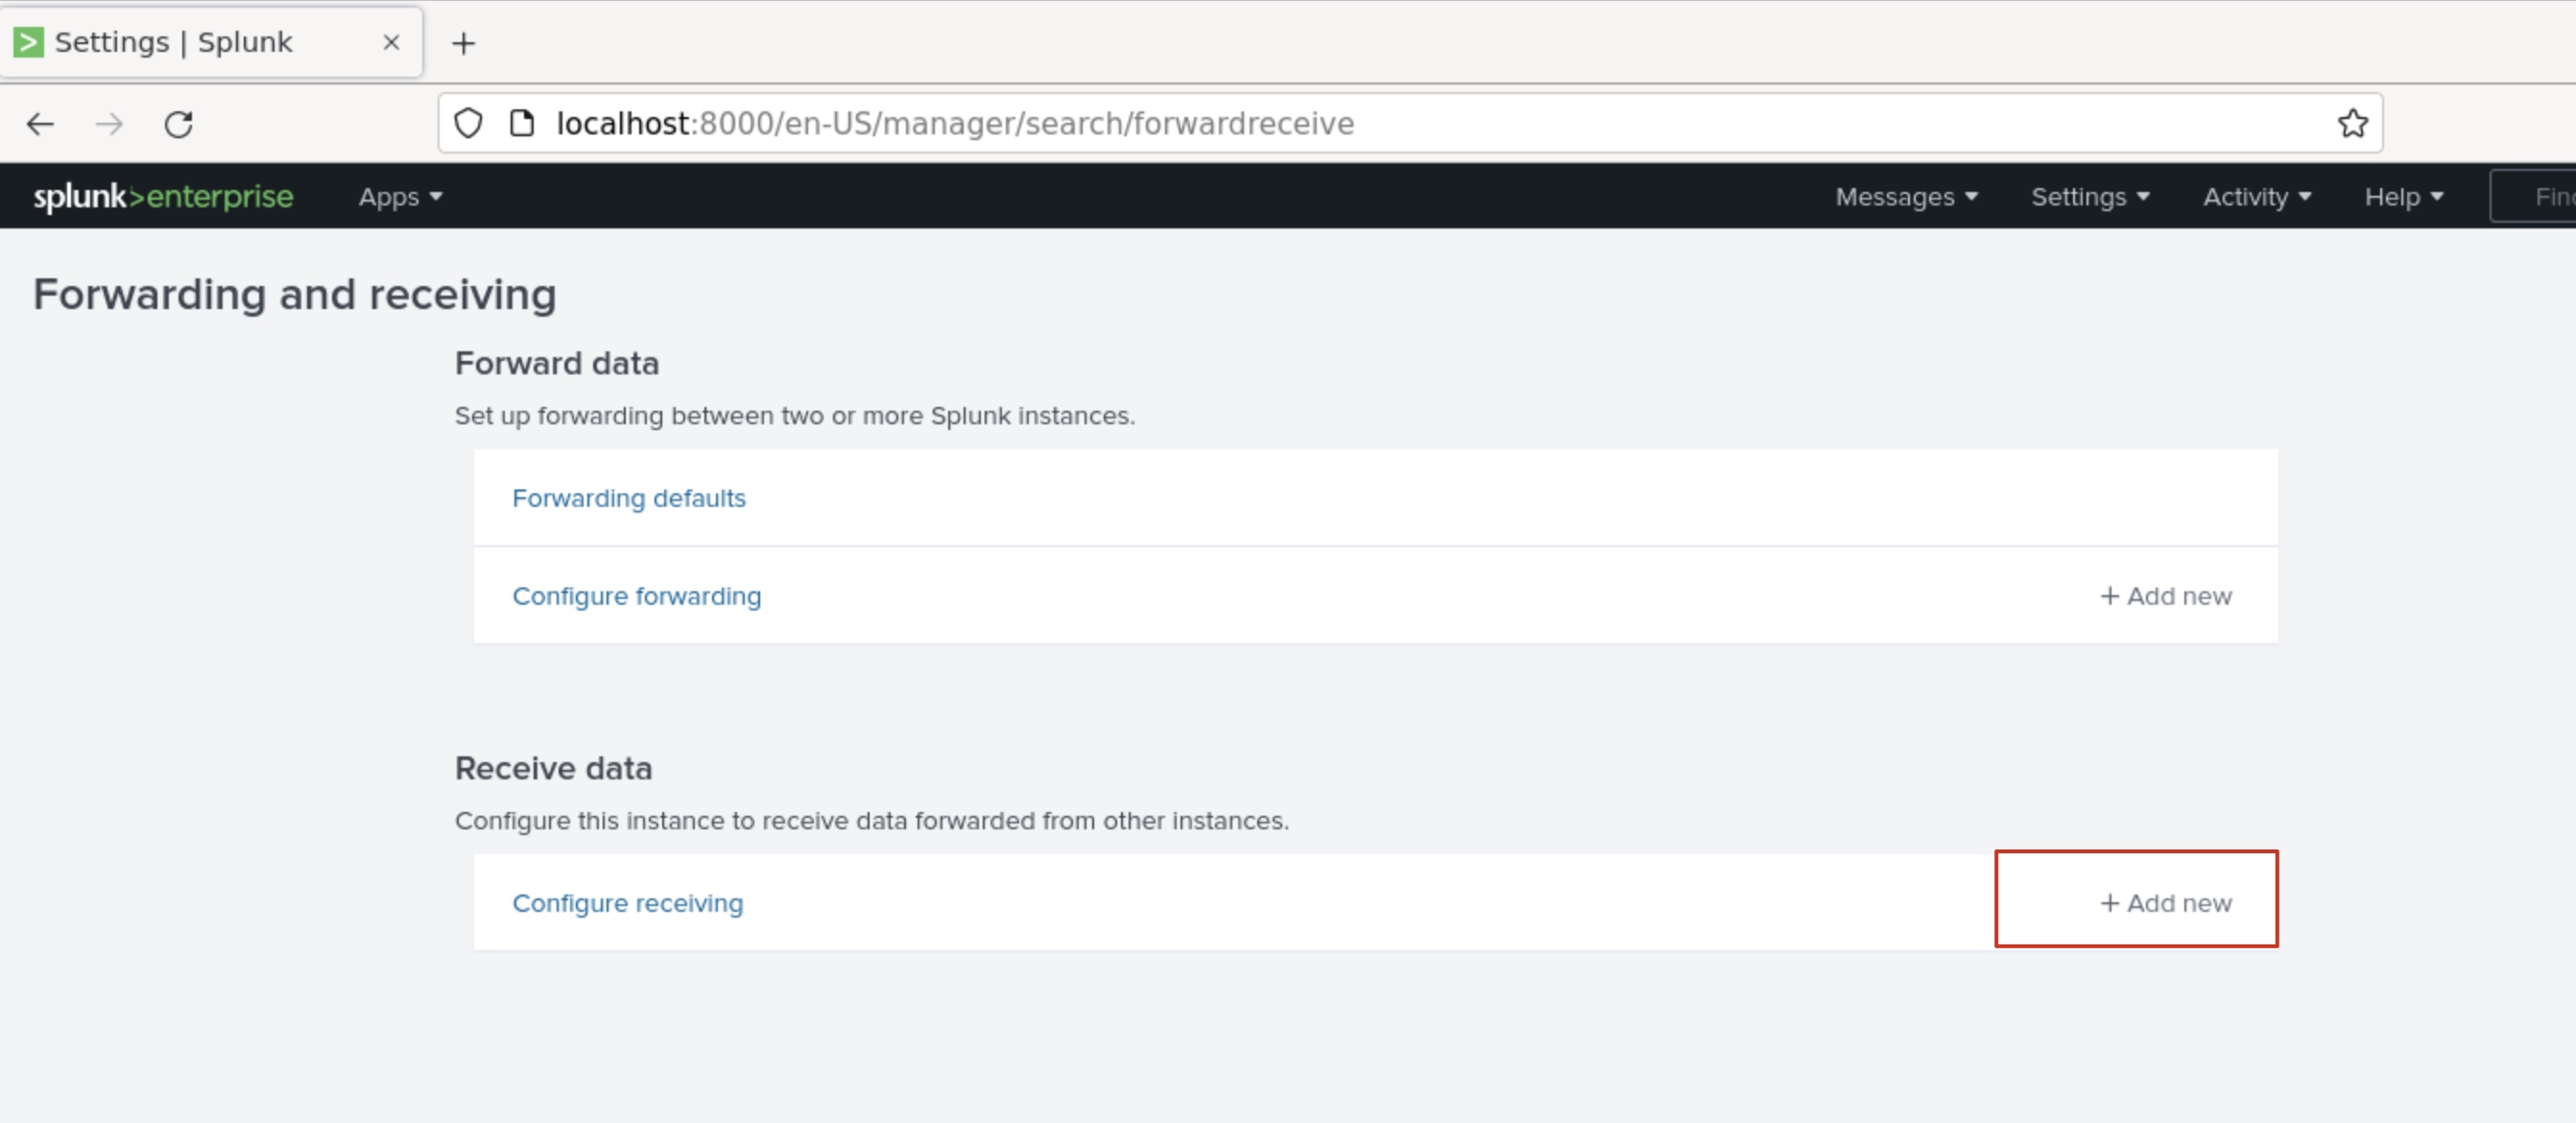
Click on Add new to Configuring receiving under Receive data.
Enter 9997 as the receiving port. And then, click on Save.
Task 2: Set up and configure Sysmon and Splunk Universal Forwarder on the Windows machine.
Step 9: On the Windows machine, open Powershell and navigate to the Tools directory present on the Administrator's Desktop. The Sysmon installer is present here. Install Sysmon with the given configuration file using the following command. This will also accept the license if not already accepted.
Command:
./Sysmon64.exe -accepteula -i sysmonconfig.xml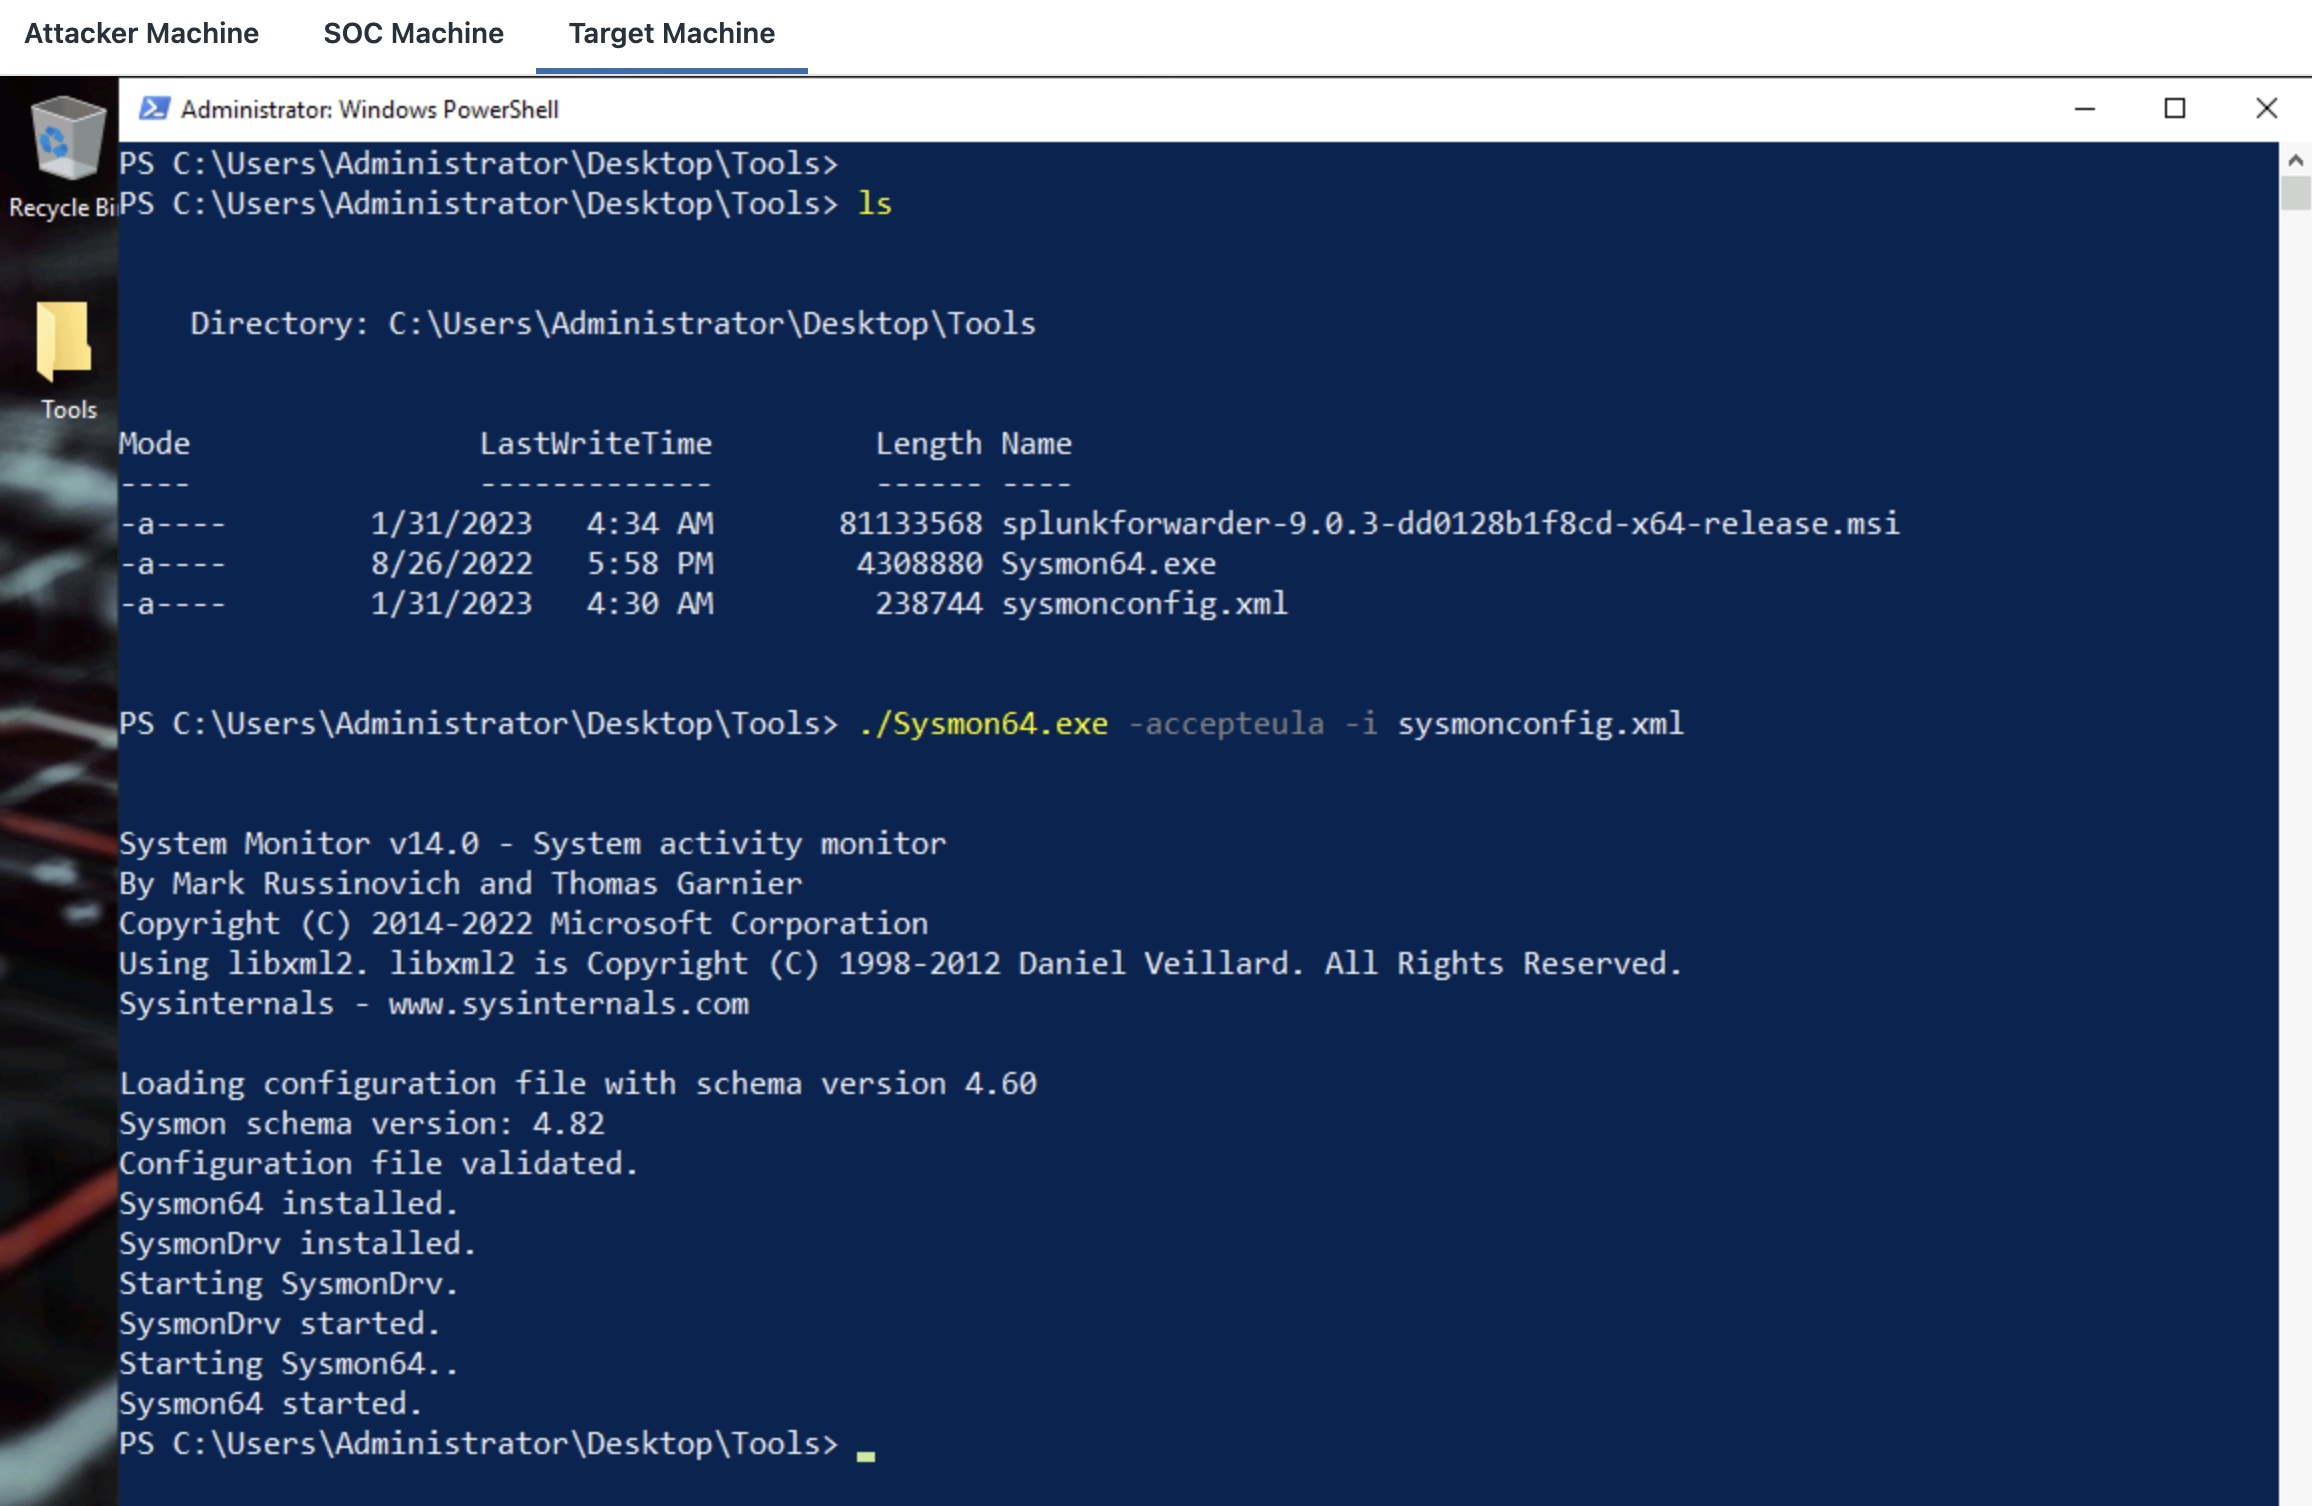
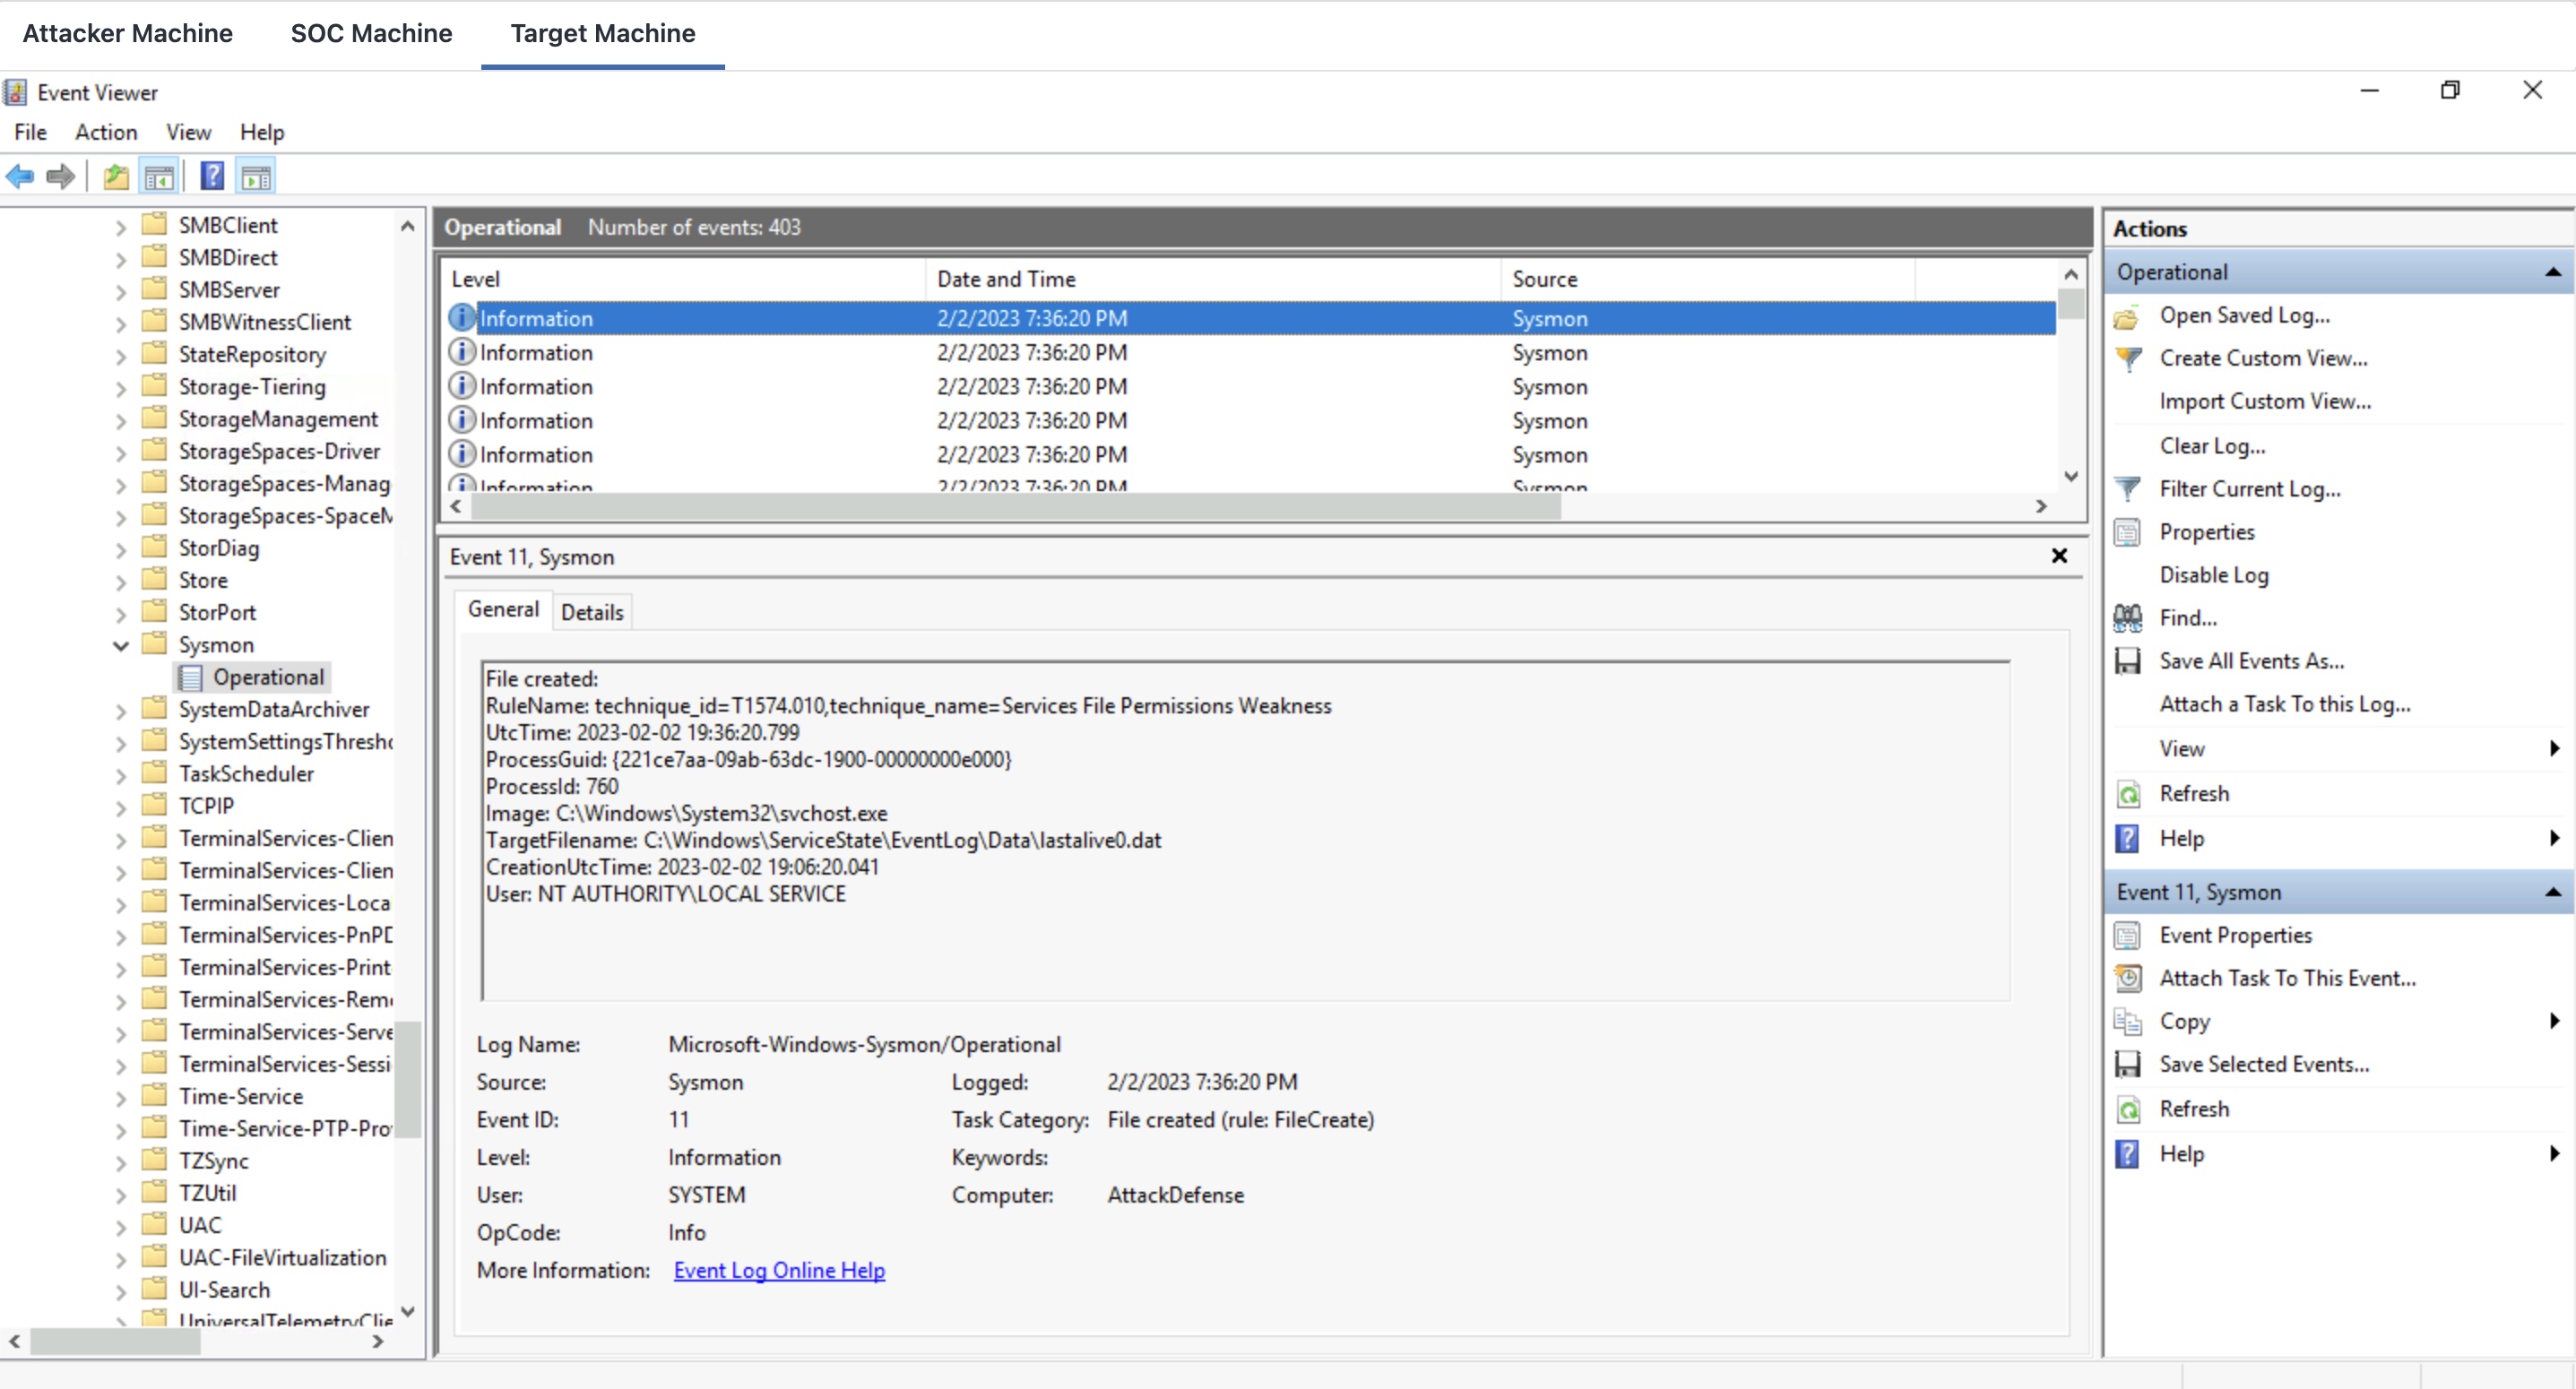
Sysmon is now installed. You can find the Sysmon logs in the Event Viewer by navigating to Applications and Services Logs > Microsoft > Windows > Sysmon.
Step 10: Next, install the Splunk Universal Forwarder. The installer is present in the Tools directory. But first, you need to know the IP address of the receiving indexer or the Ubuntu machine where Splunk is running.
Command:
ip addr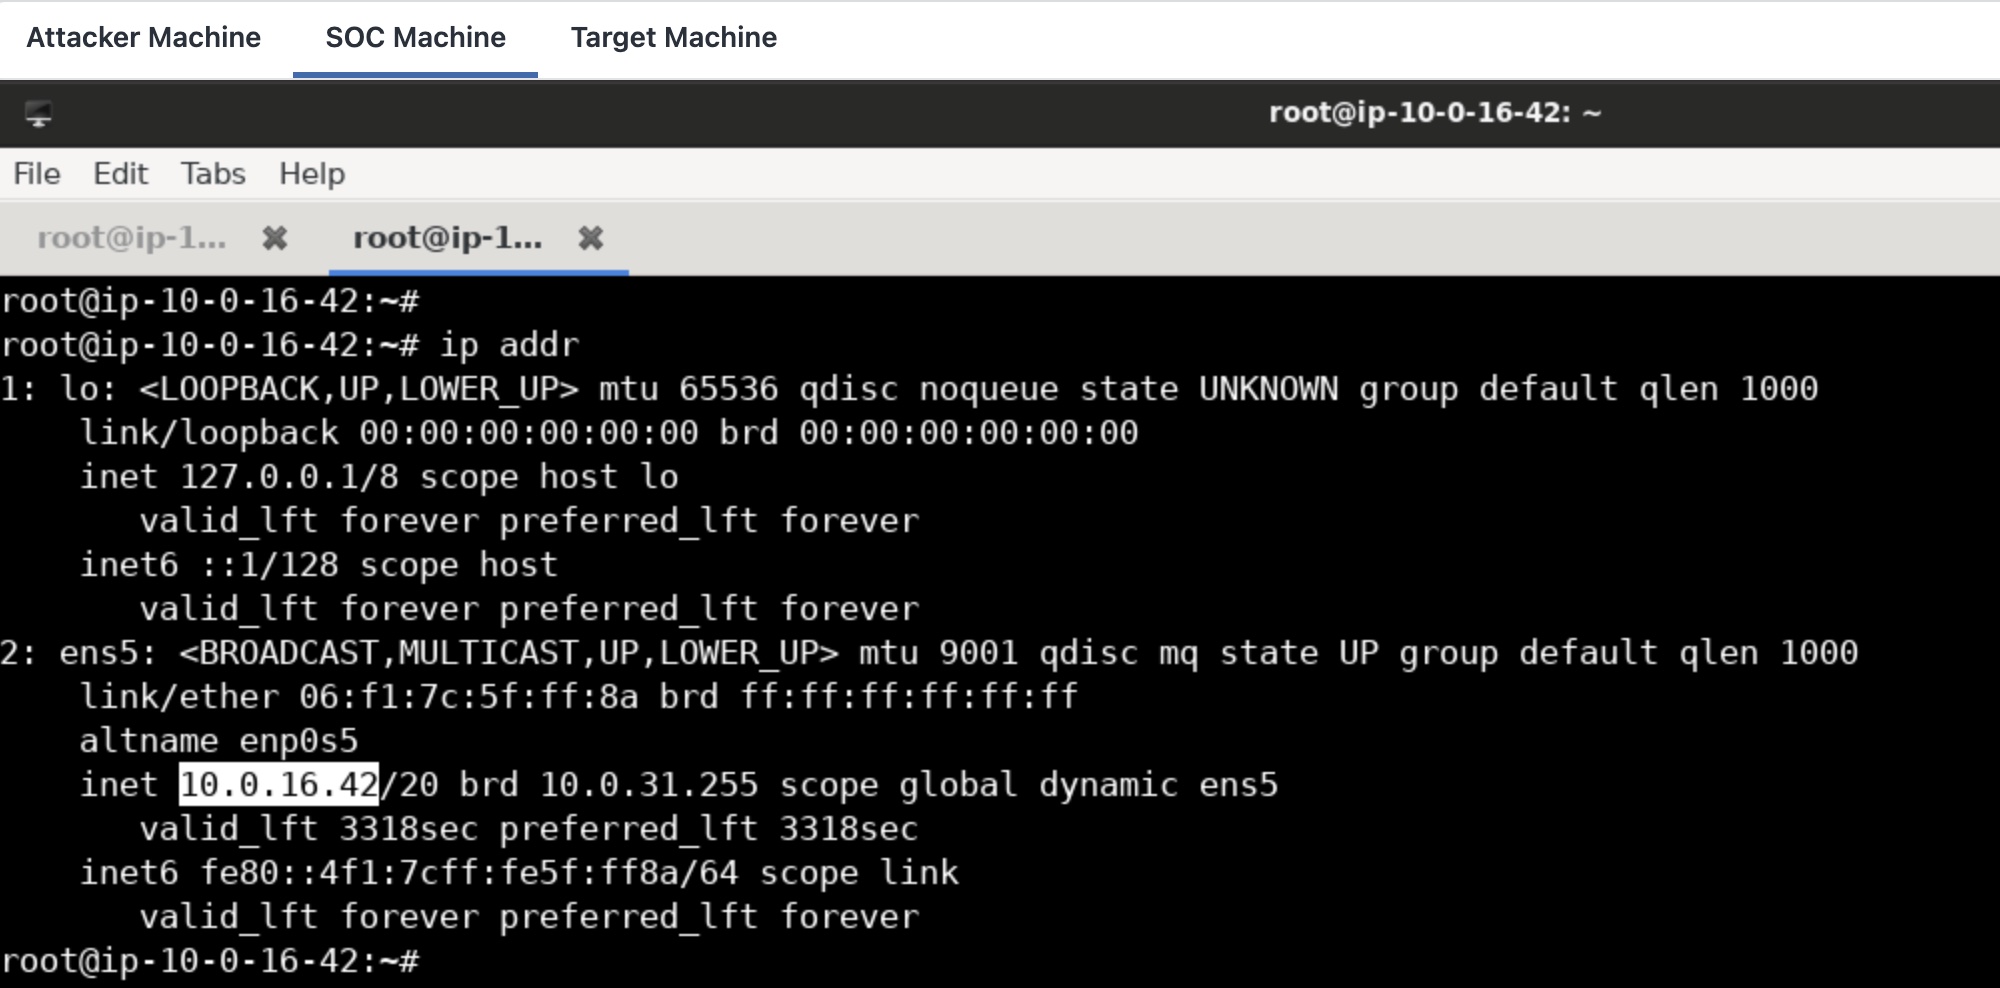
10.0.16.42 is the IP address of the machine where Splunk is running.
Now, you can use the following command on Powershell to quietly install the forwarder.
Command:
msiexec.exe /i splunkforwarder-9.0.3-dd0128b1f8cd-x64-release.msi RECEIVING_INDEXER="10.0.16.42:9997" AGREETOLICENSE=Yes /quiet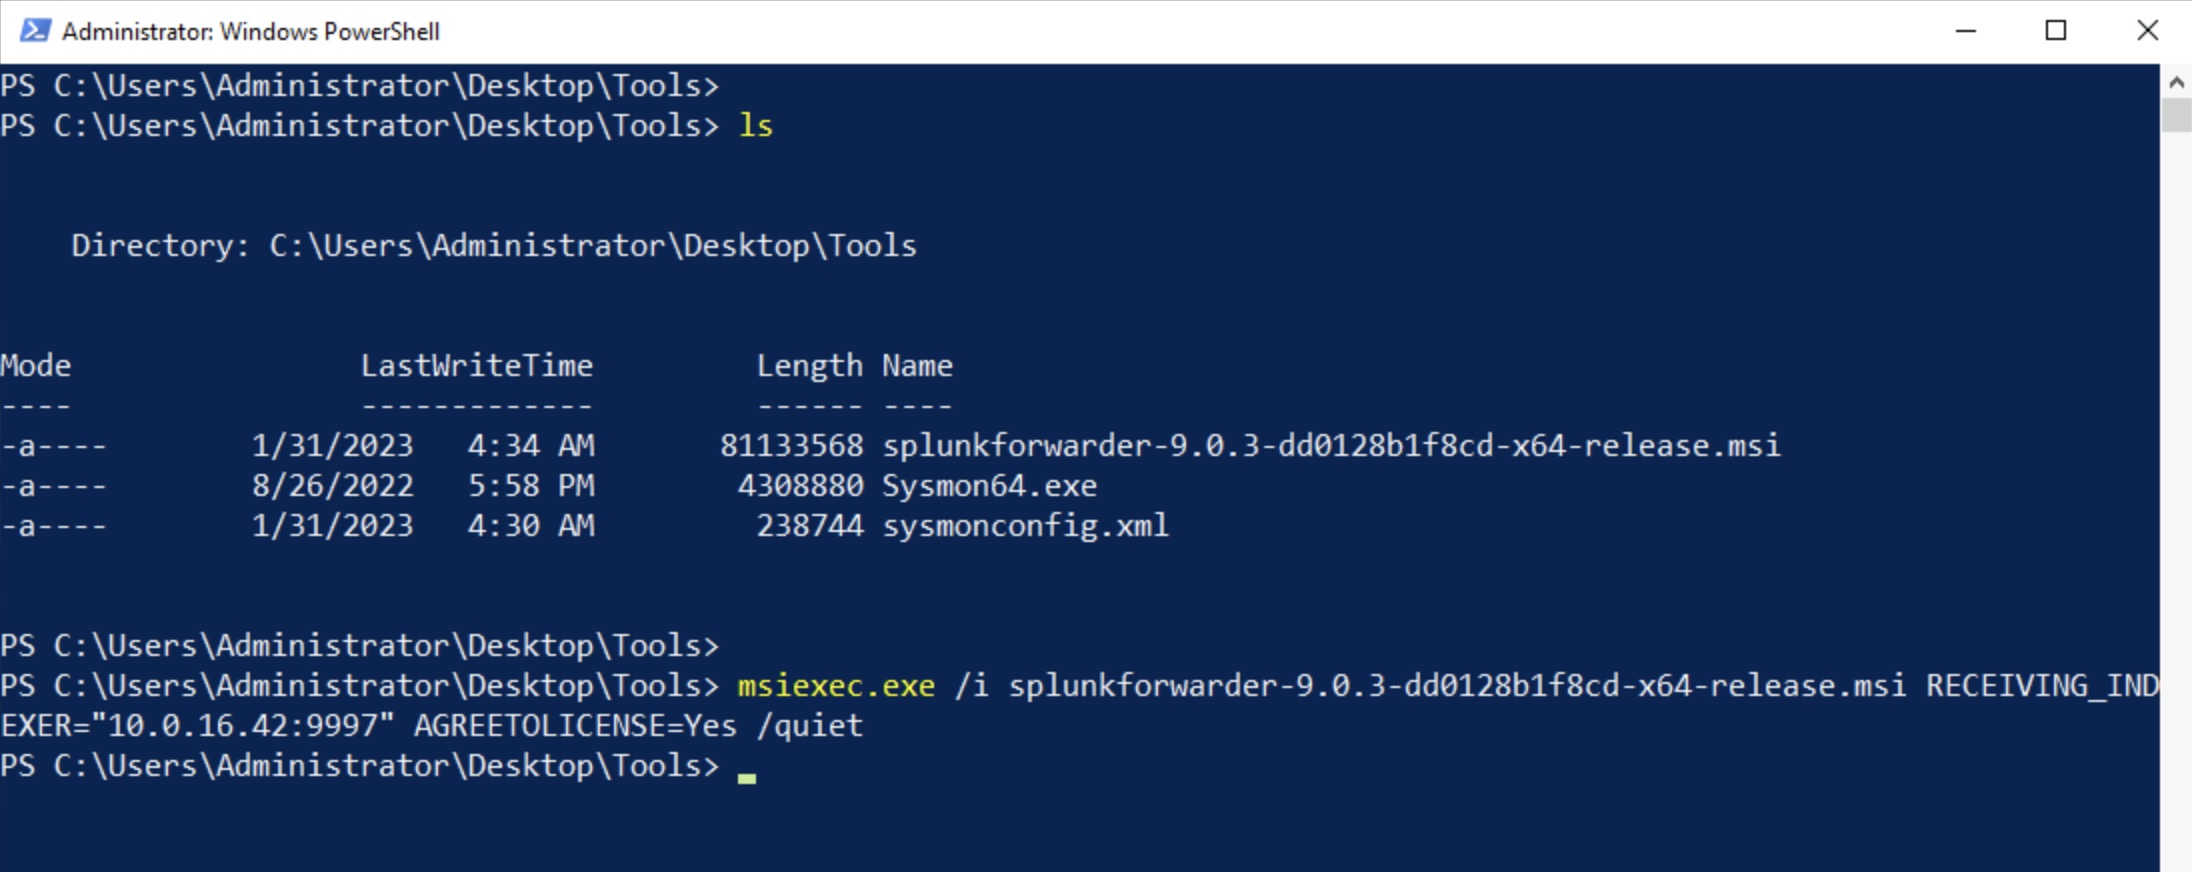
Wait for a minute before proceeding to the next step.
Step 11: After the forwarder is installed, create an inputs.conf file in C:\Program Files\SplunkUniversalForwarder\etc\system\local\ with the following content:
[WinEventLog://Microsoft-Windows-Sysmon/Operational]
index = sysmon
sourcetype = "XmlWinEventLog:Microsoft-Windows-Sysmon/Operational"
disabled = false
renderXml = false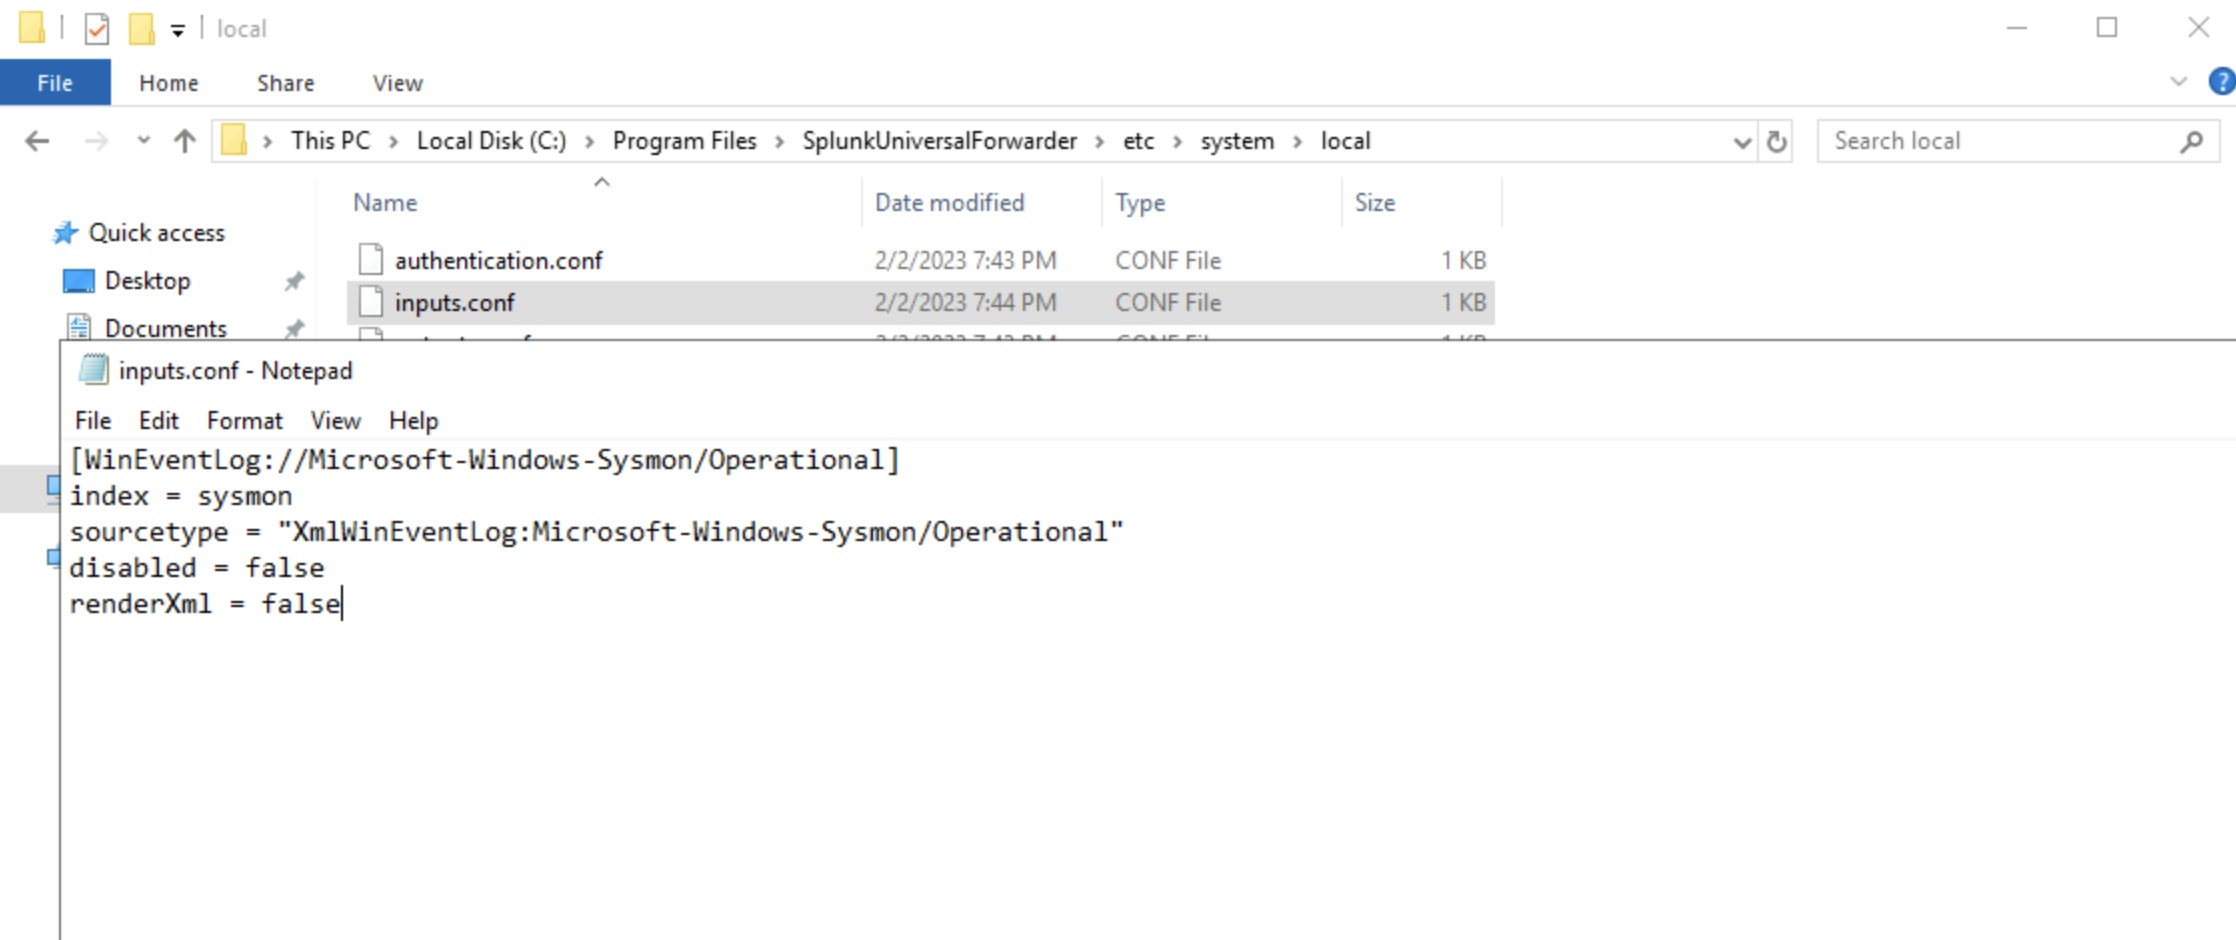
Save and close the file. Restart the Splunk Universal Forwarder. Ignore any error that you might notice.
Command:
& 'C:\Program Files\SplunkUniversalForwarder\bin\splunk.exe' restart
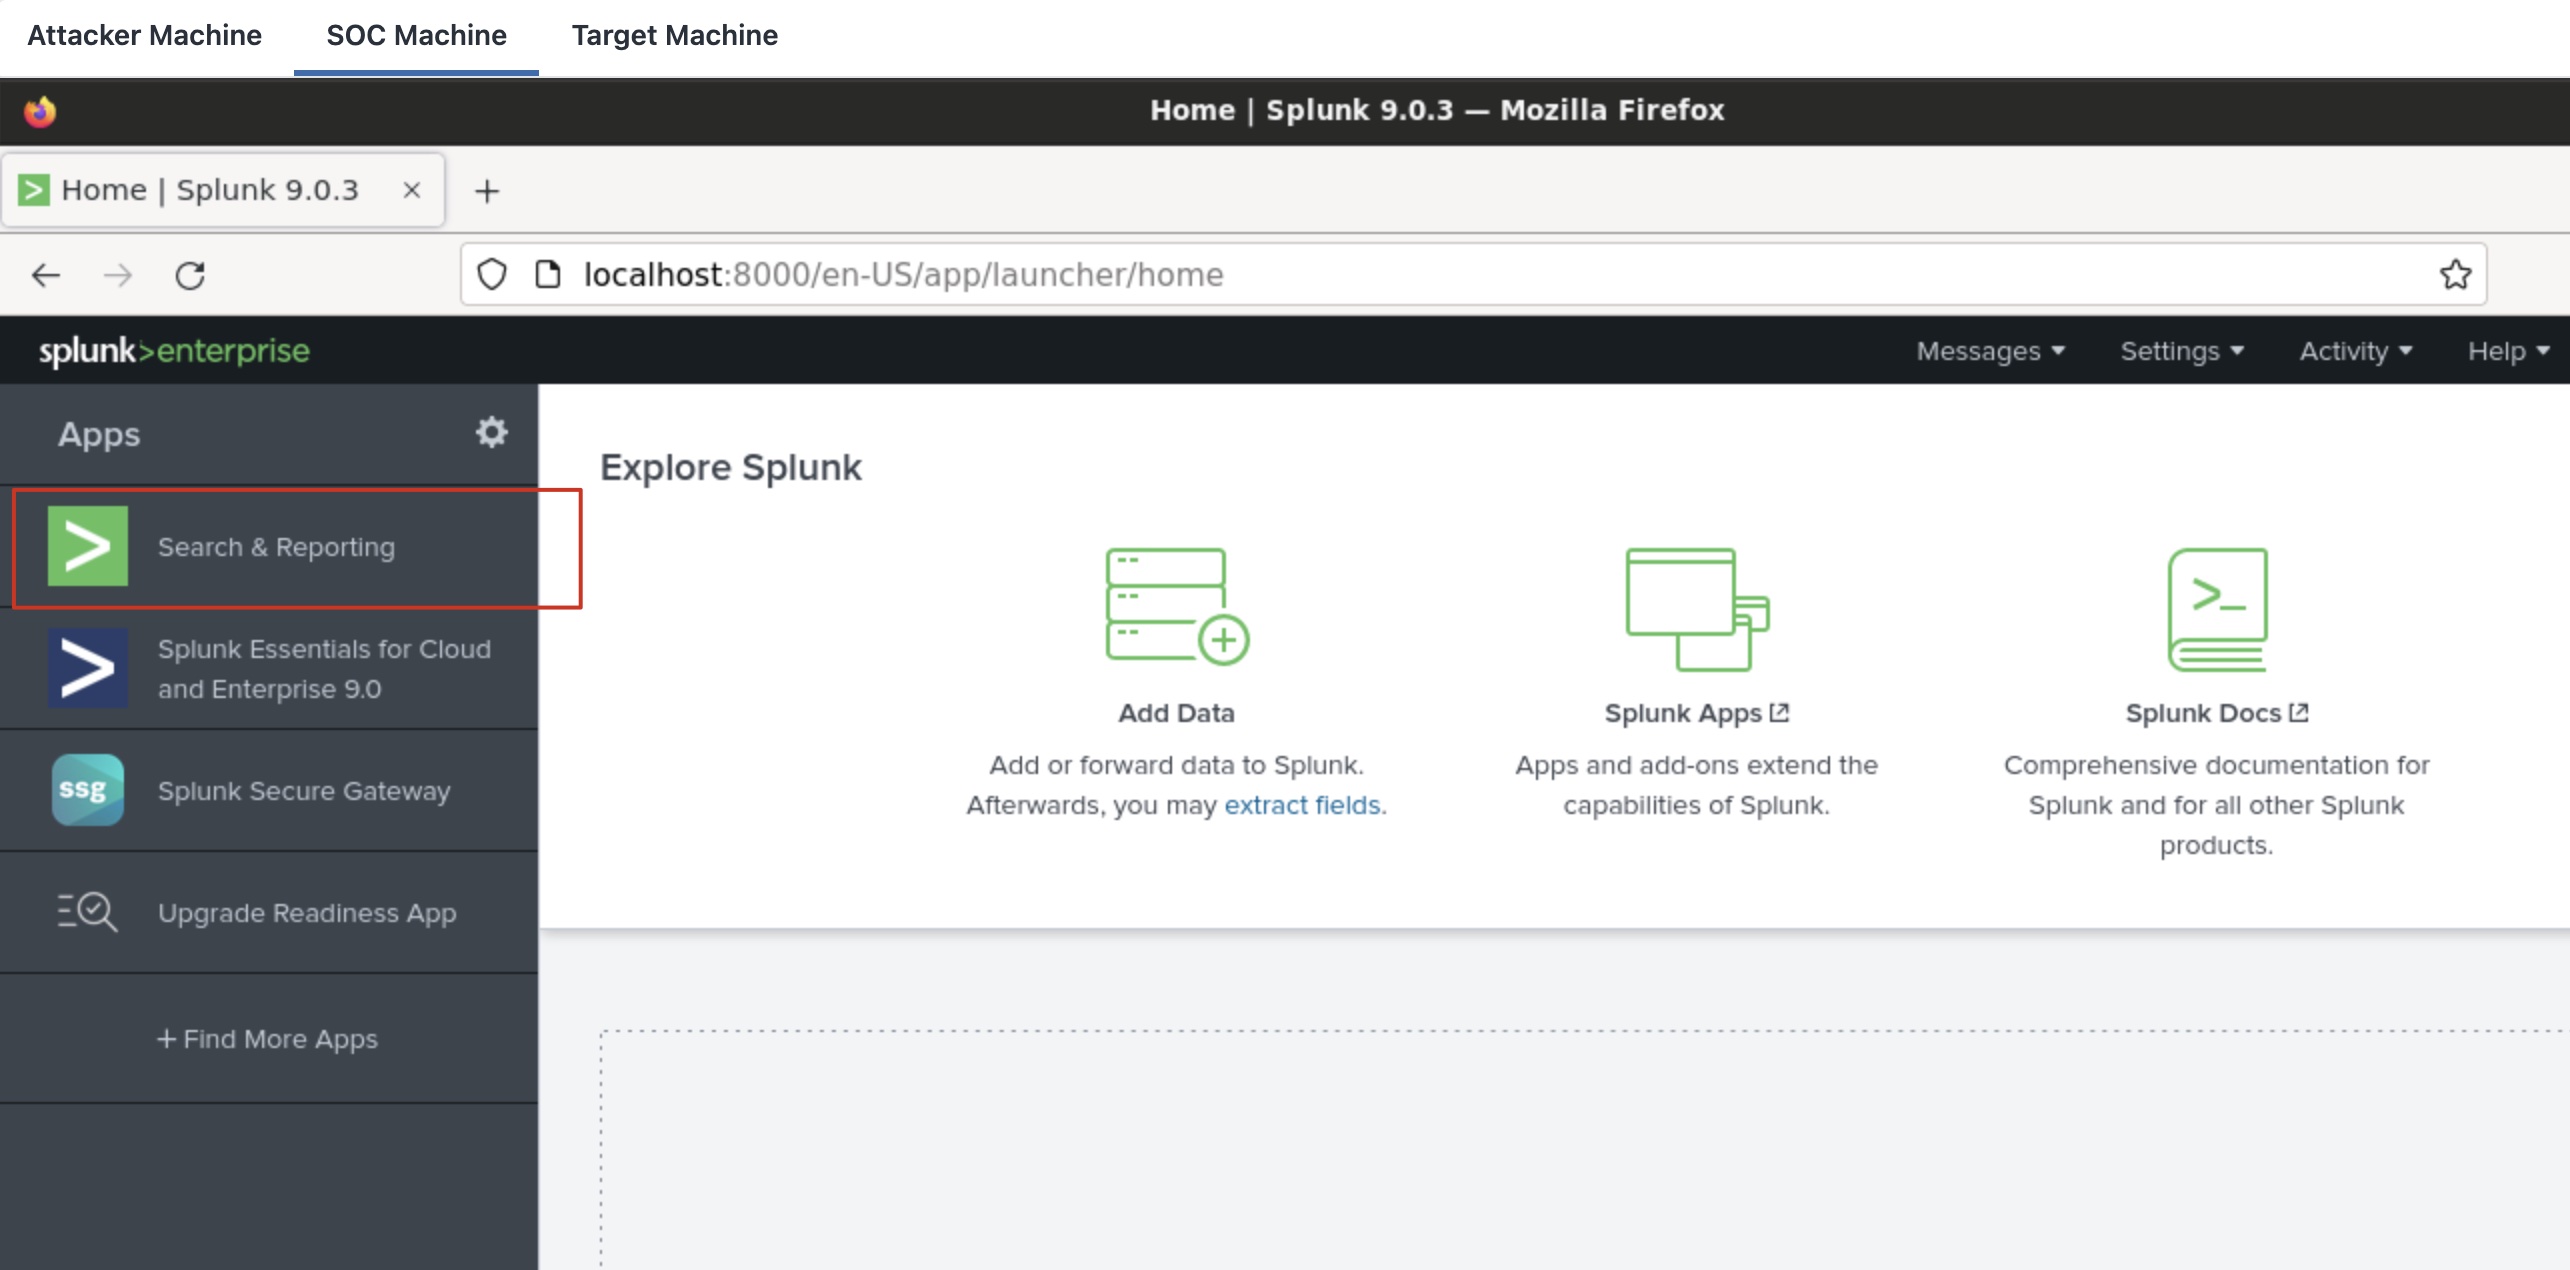
Step 12: Now, switch back to the Ubuntu machine, and go to the Search & Reporting app on Splunk.
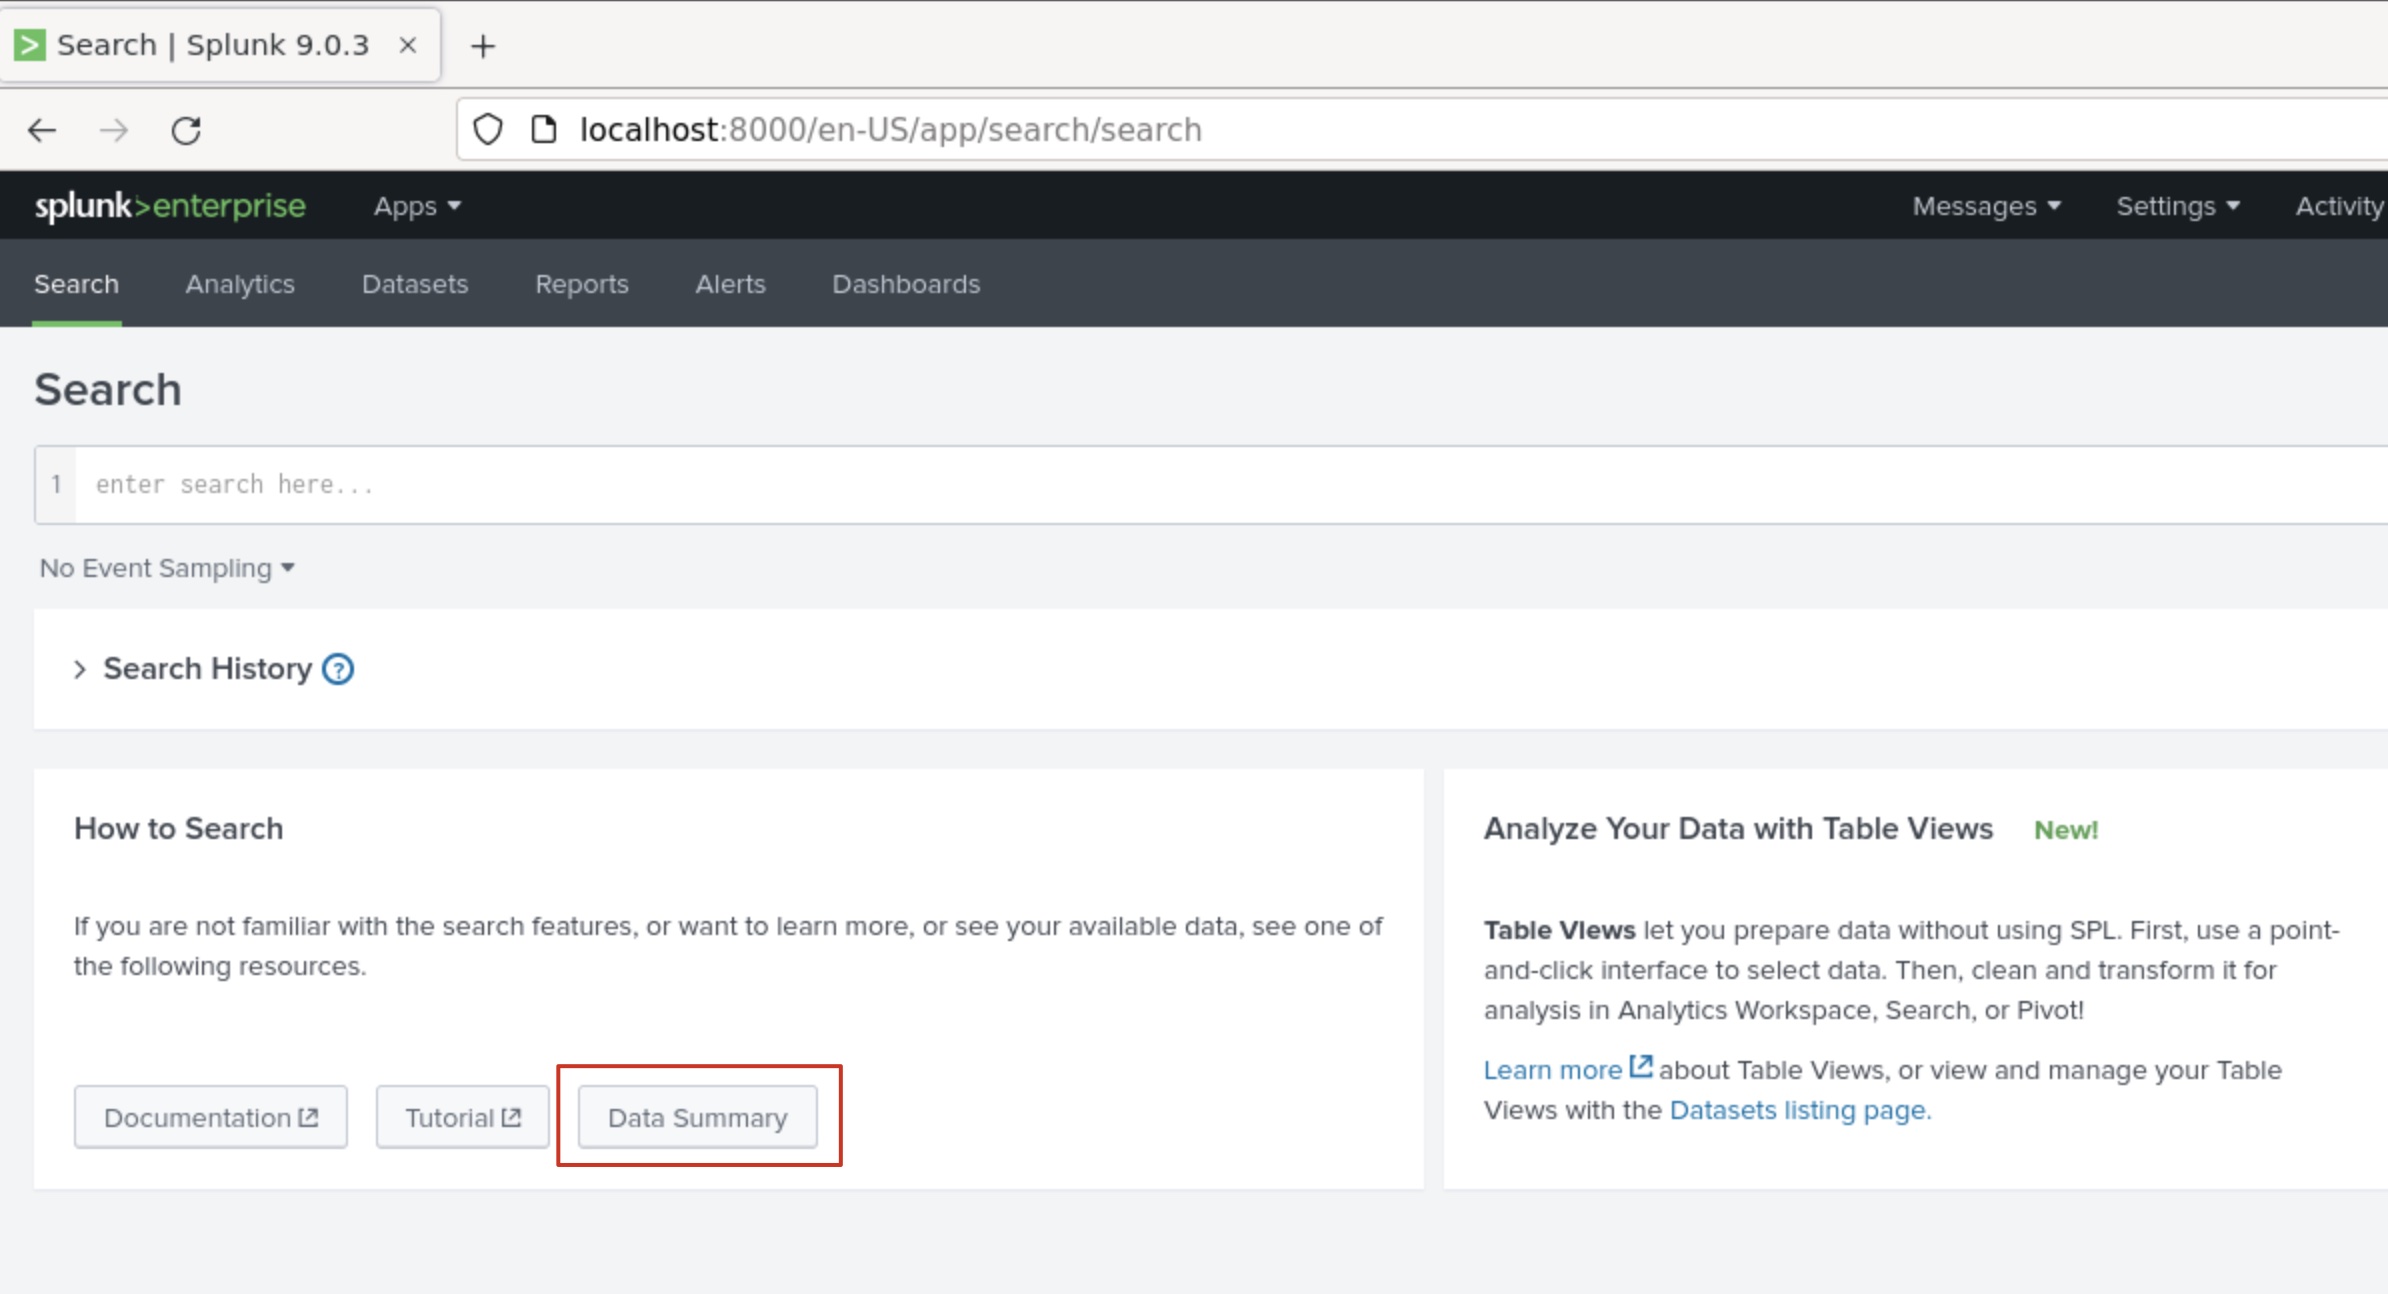
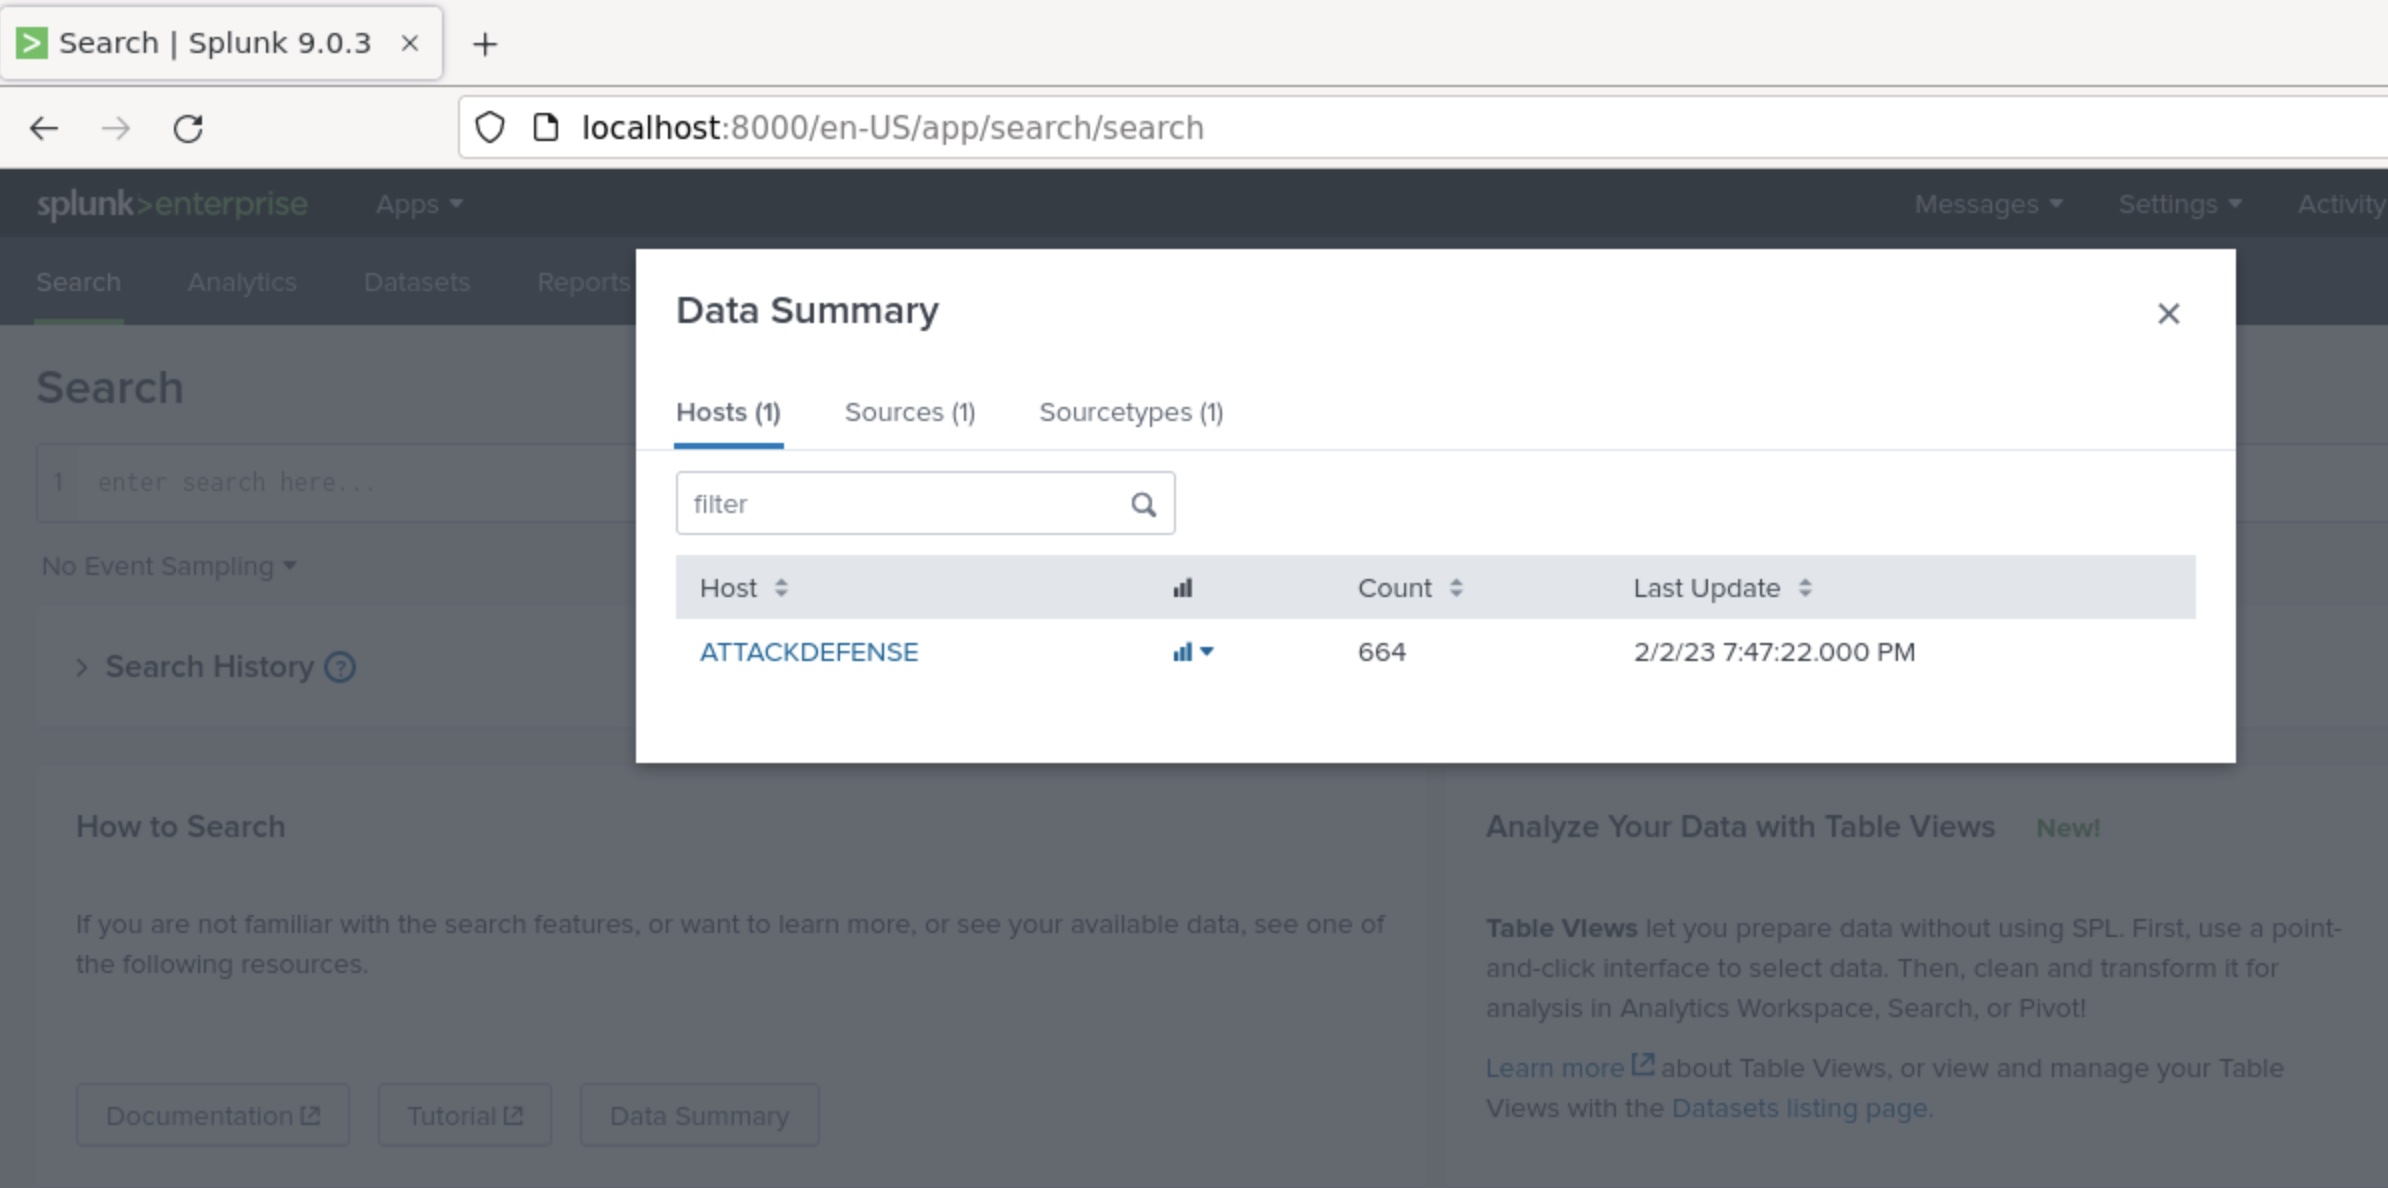
You can click on Data Summary to view active hosts and other related information.
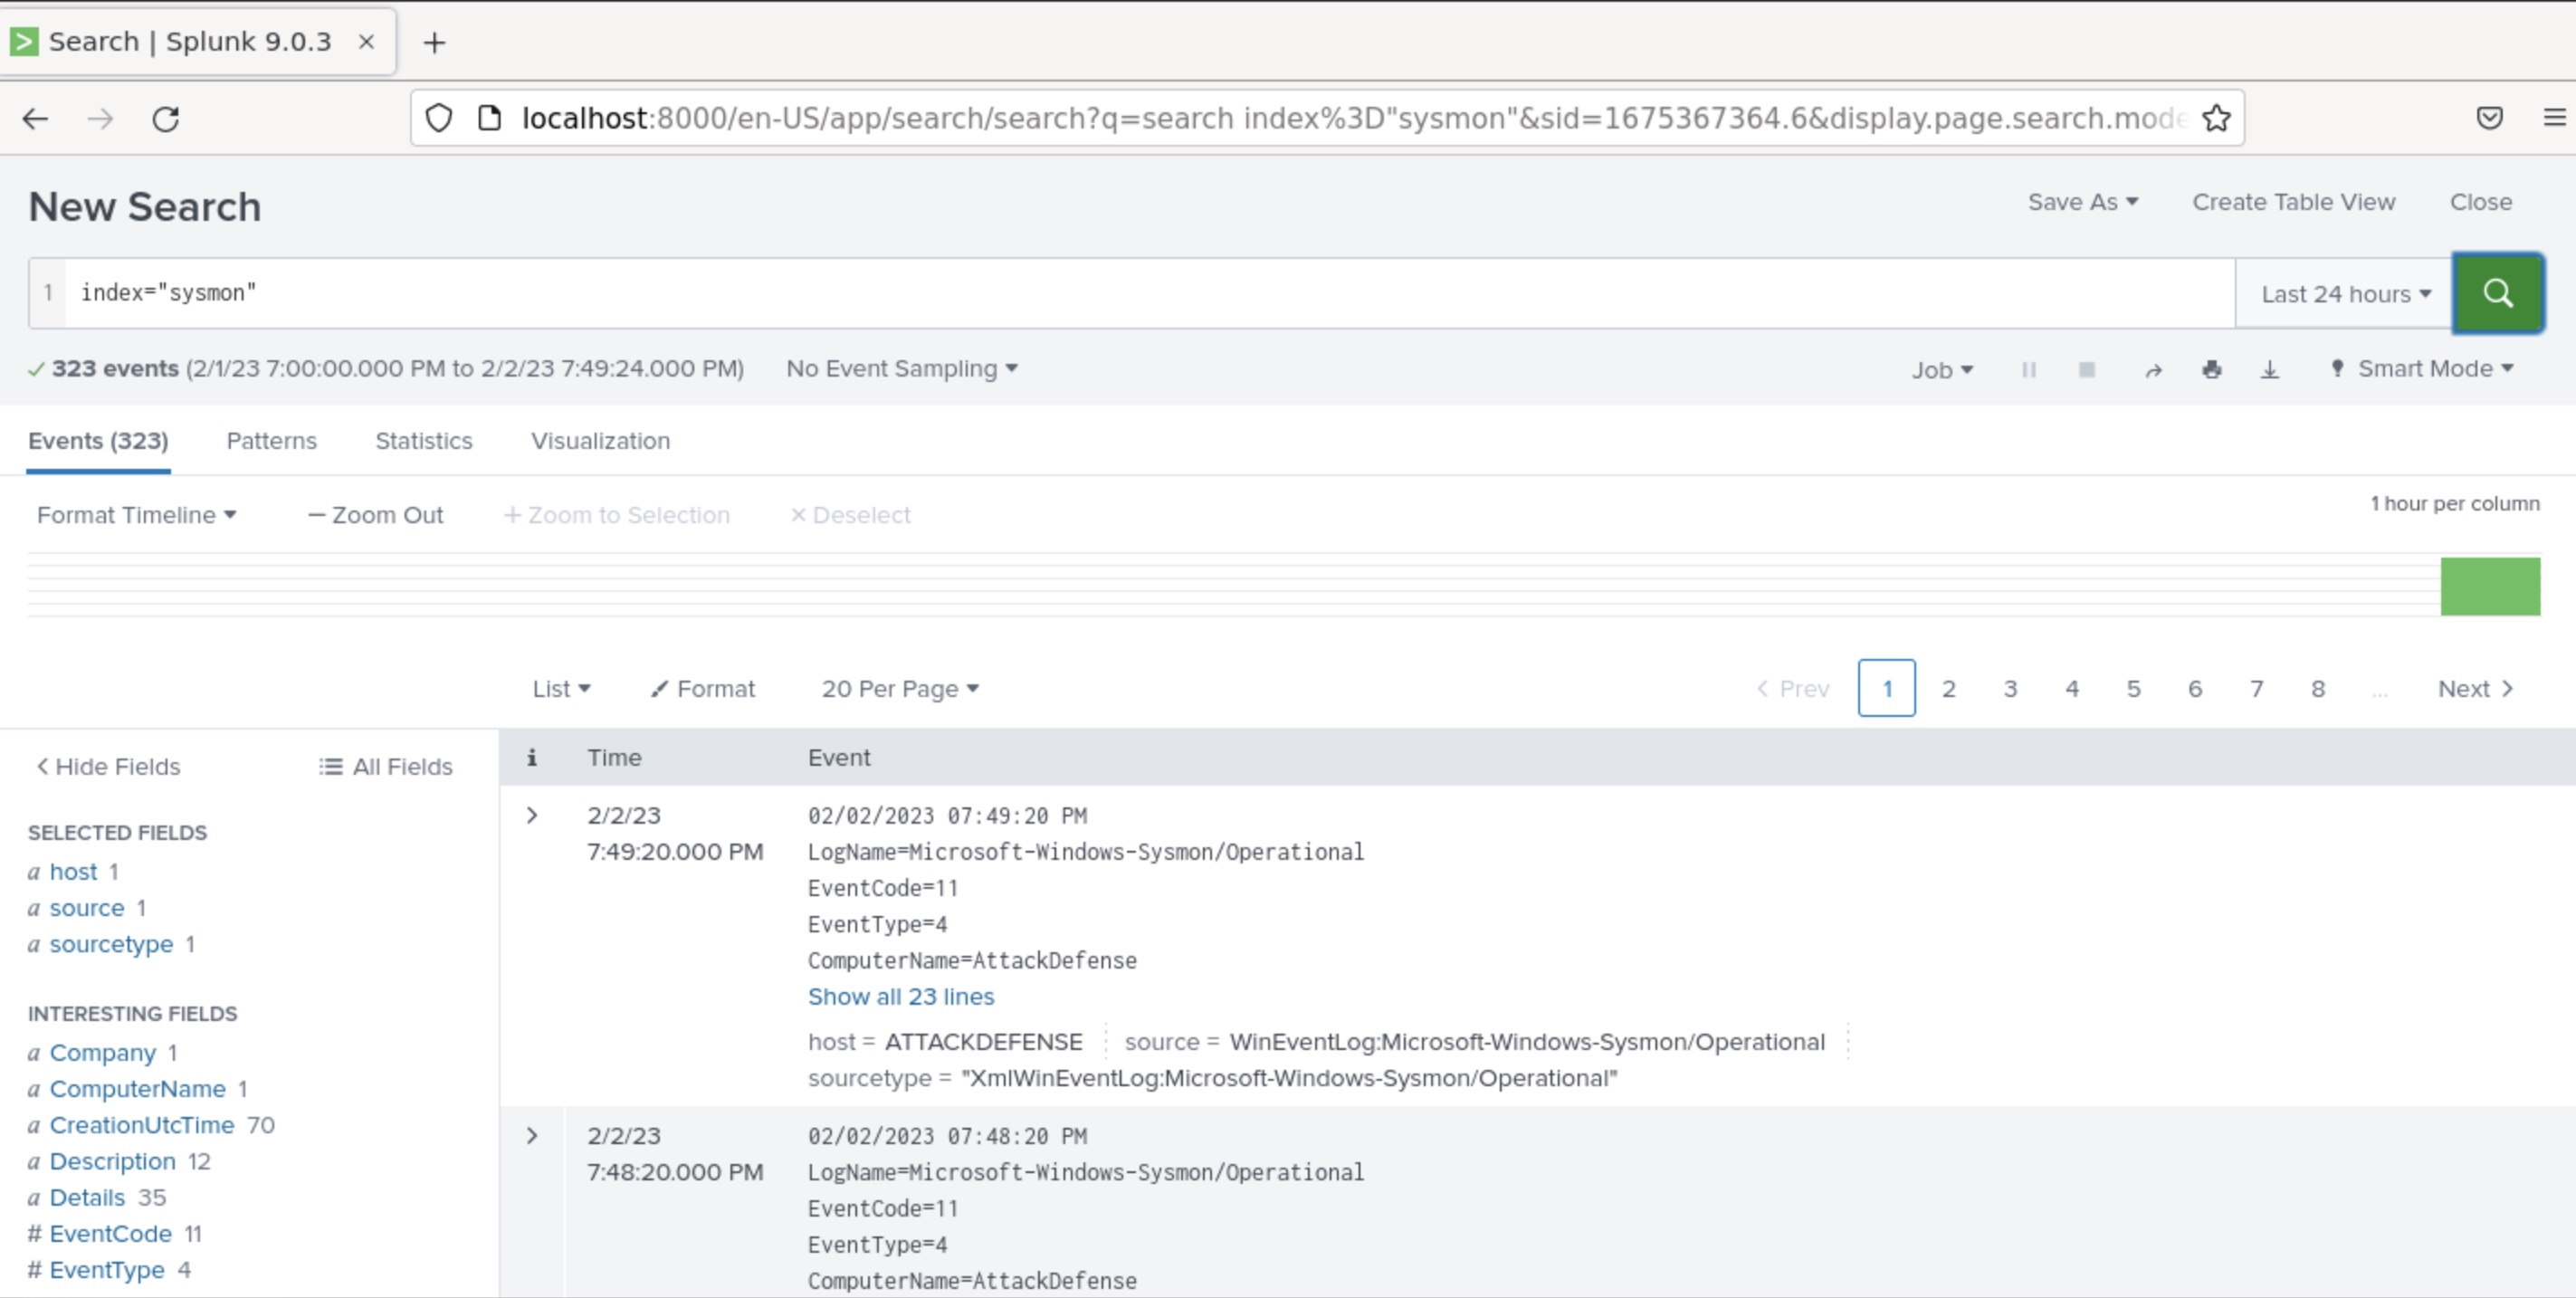
Step 13: Now, you can view all the Sysmon events using the following query:
index="sysmon"This shows all the events generated in the last 24 hours.
Task 3: Create and run queries for the following:
- Extract events with a particular Event ID
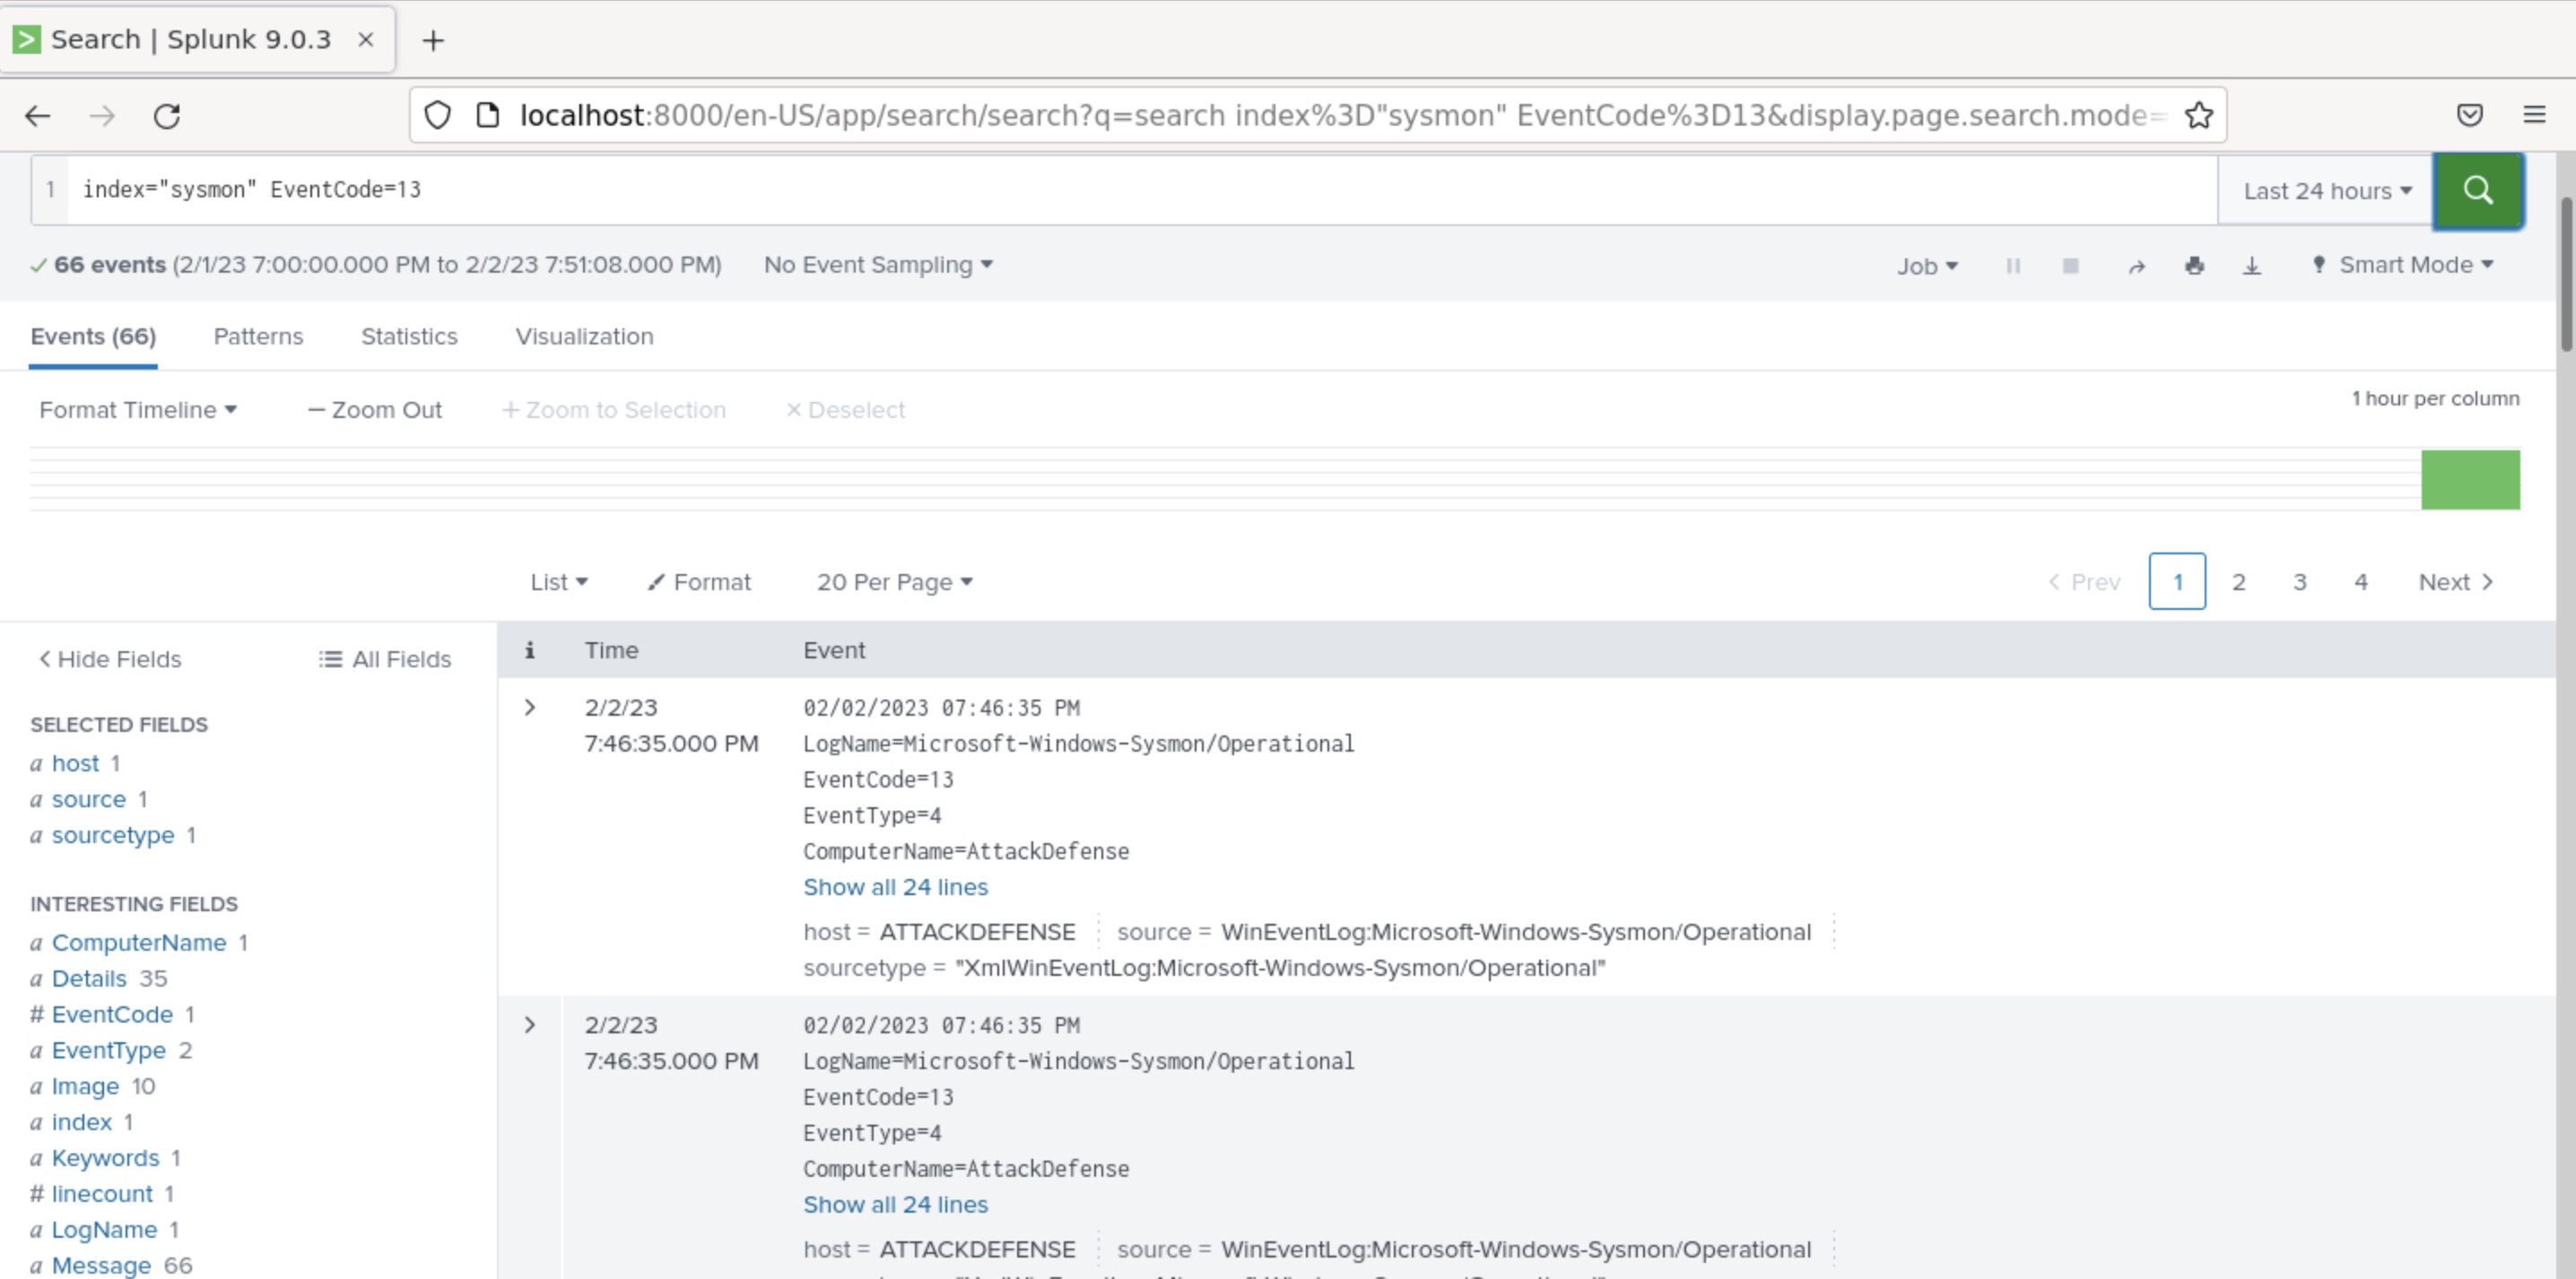
Step 14: The following query can be used to extract events with a particular Event ID say 13:
index="sysmon" EventCode=13Event ID 13 is fired every time a registry value is set.
- List all process execution activity
Step 15: All process execution activity can be listed using the following query:
index="sysmon" | stats values(ParentImage) by Image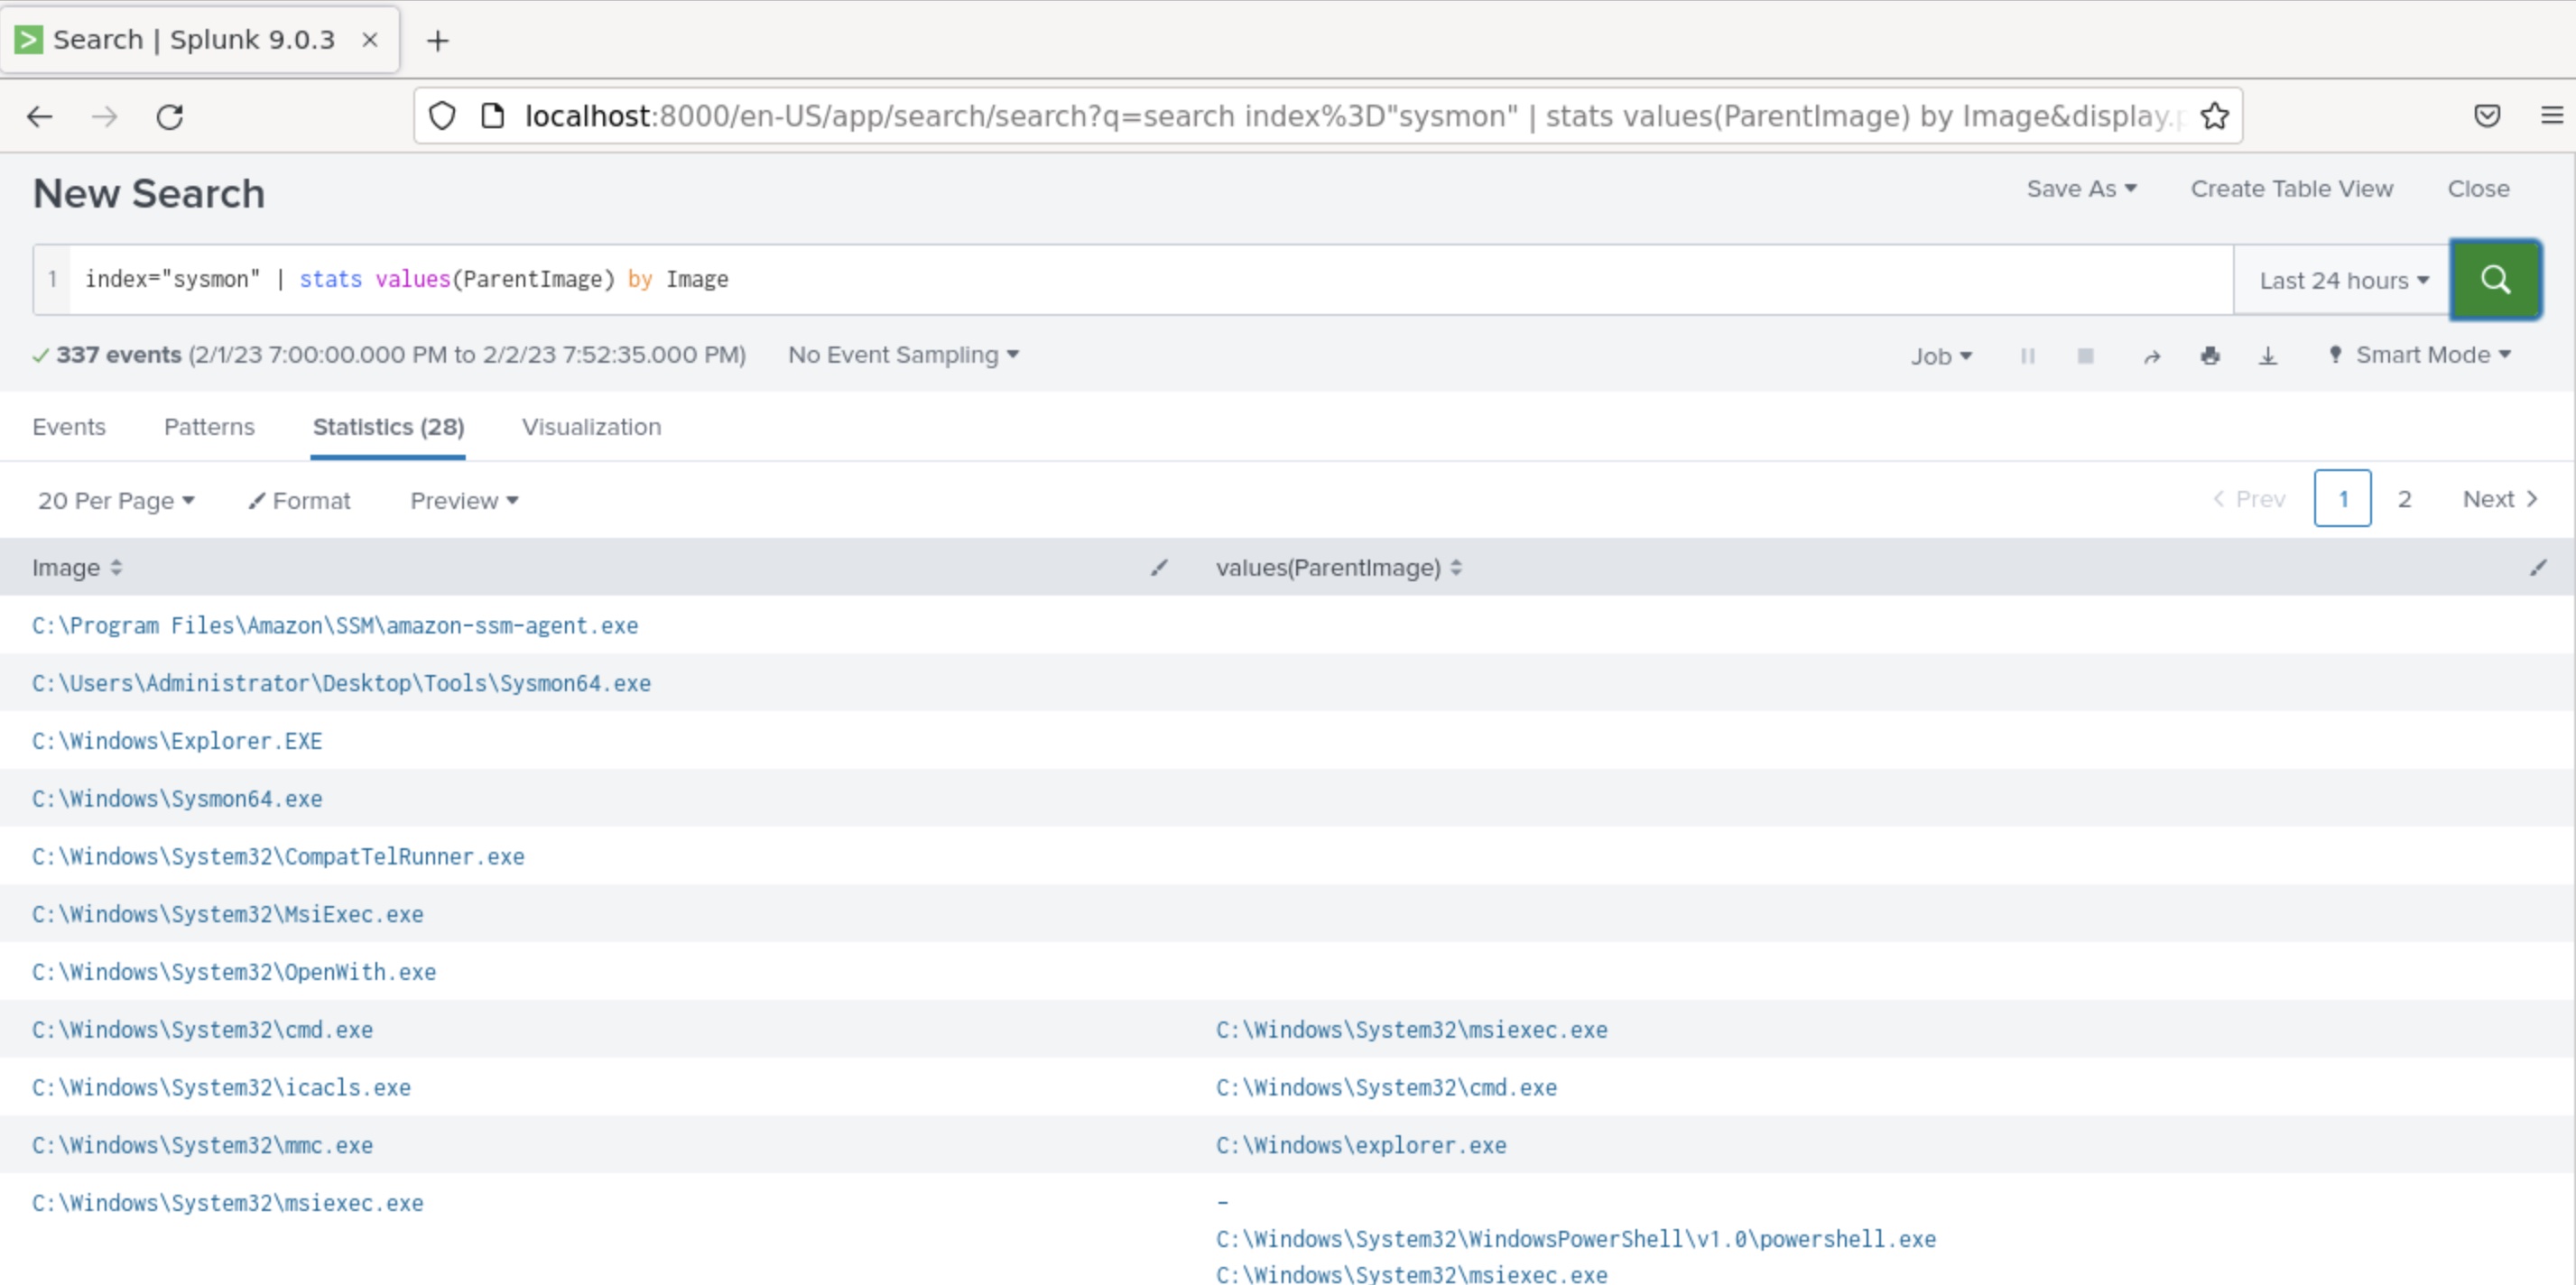
- List all commands executed by processes
Step 16: All commands executed can be listed using the following query:
index="sysmon" | stats values(CommandLine) by Image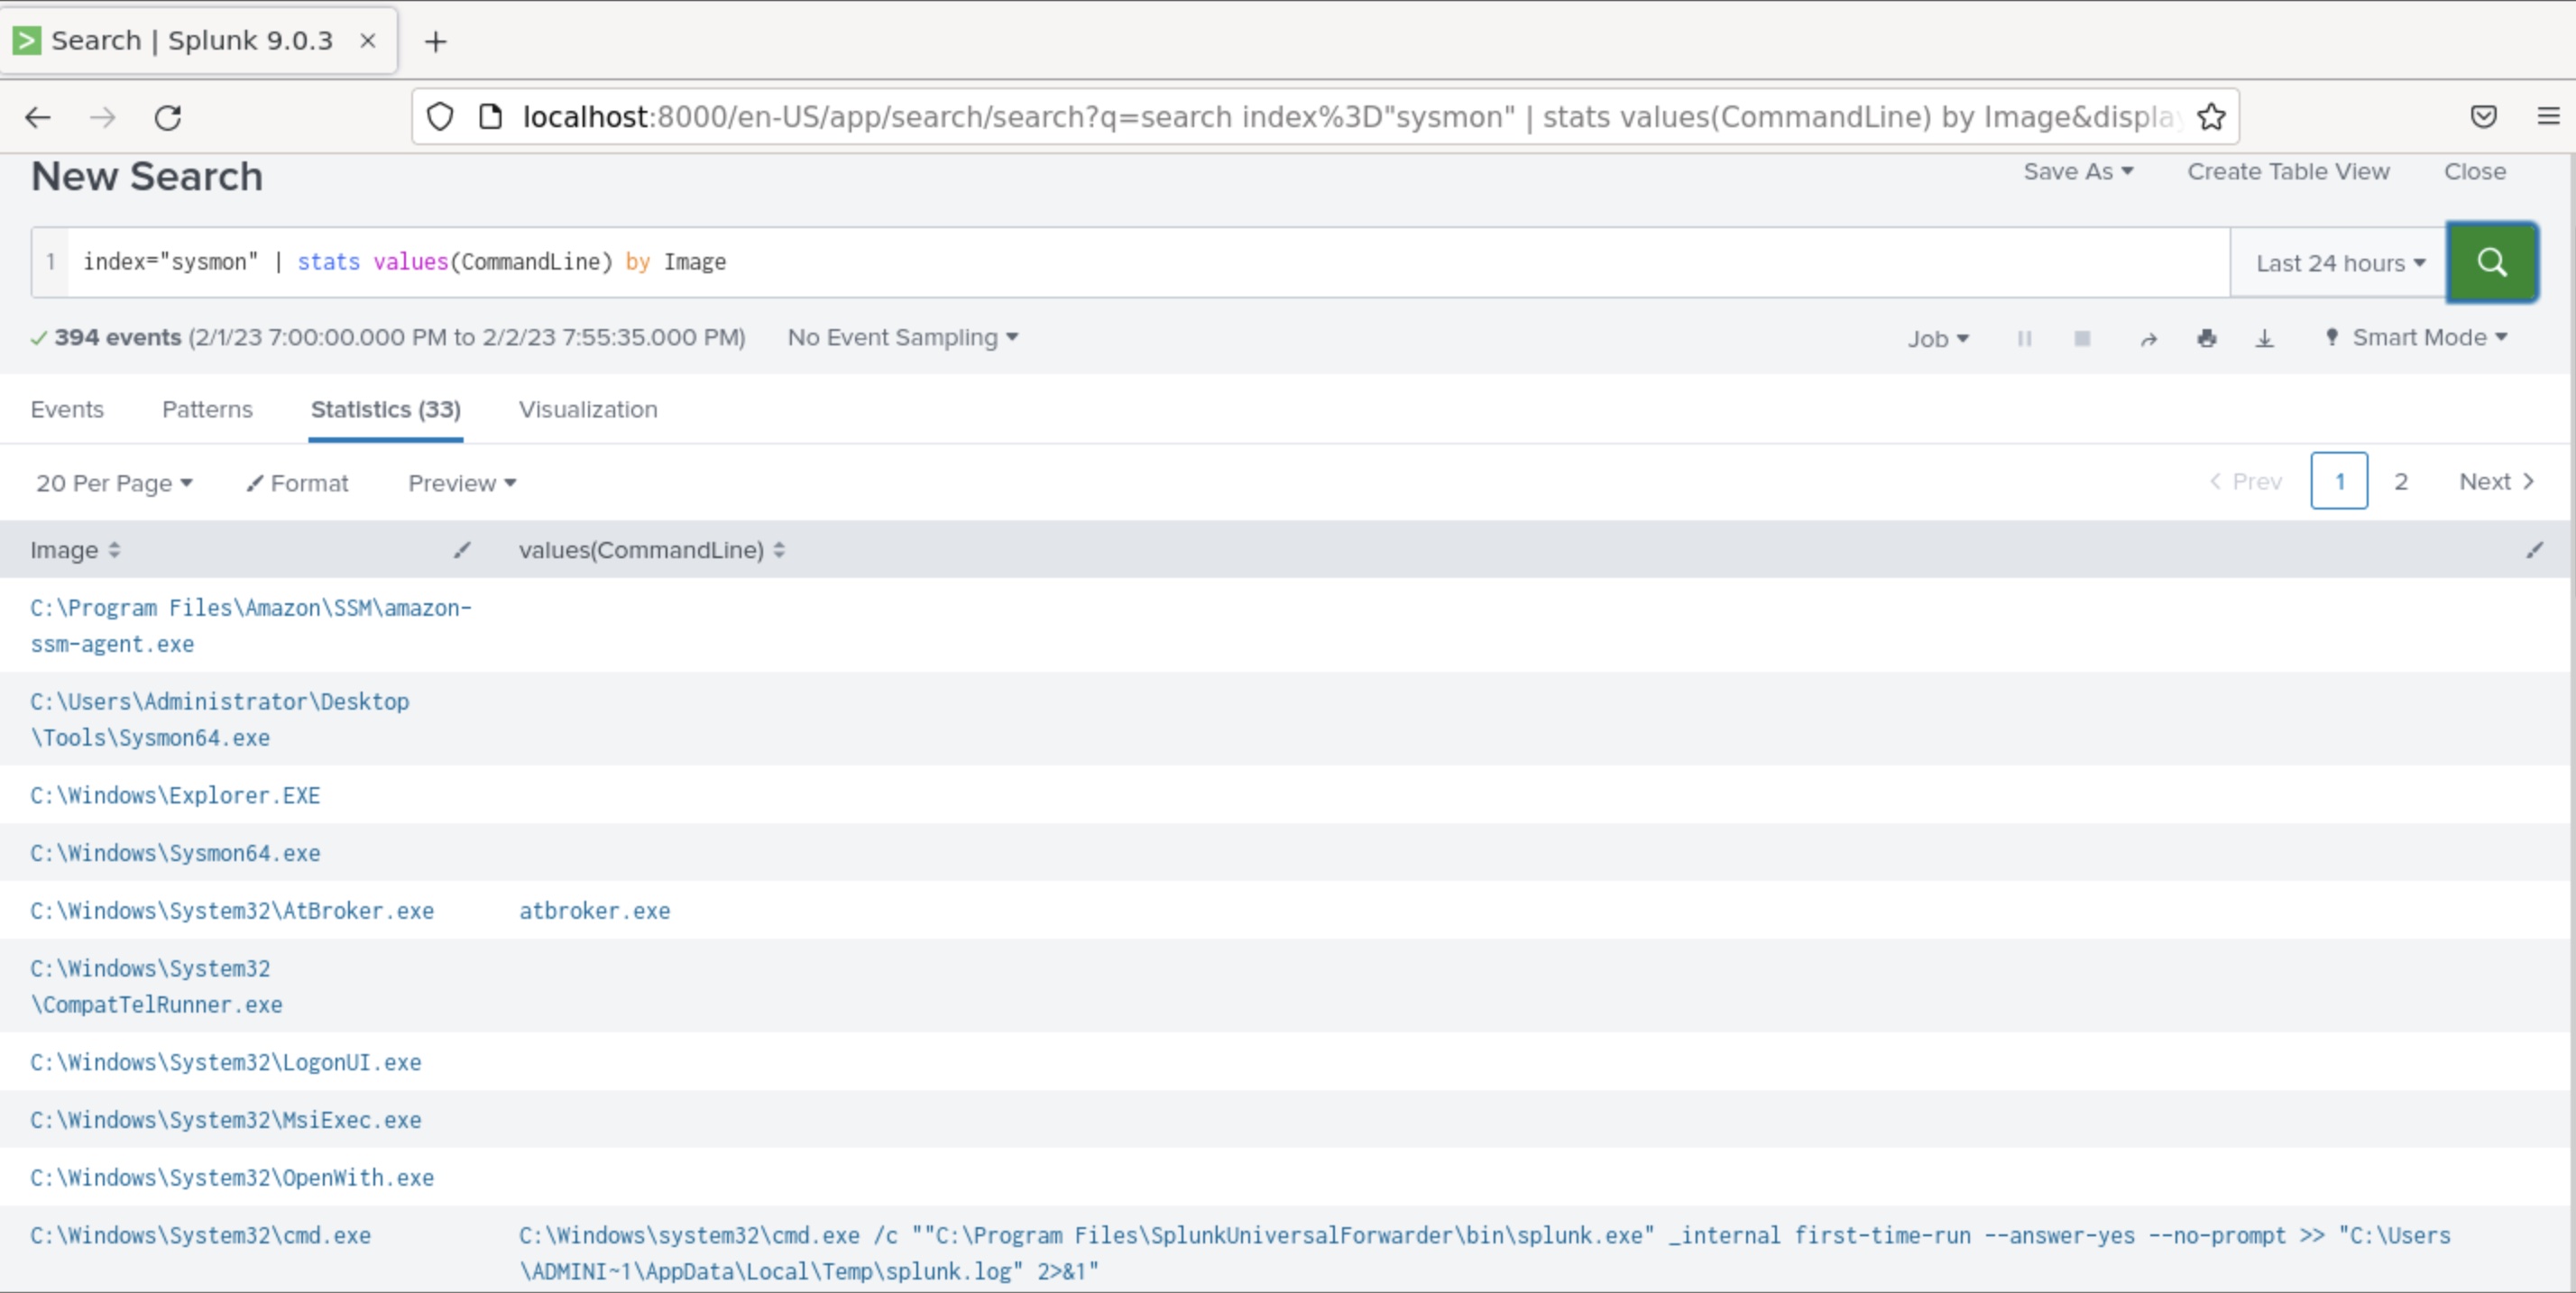
- List all commands executed by a specific process
Step 17: To list all commands executed by a specific (usually abused) process, you can use the following query:
index="sysmon" Image="*cmd.exe" | stats values(CommandLine) by Image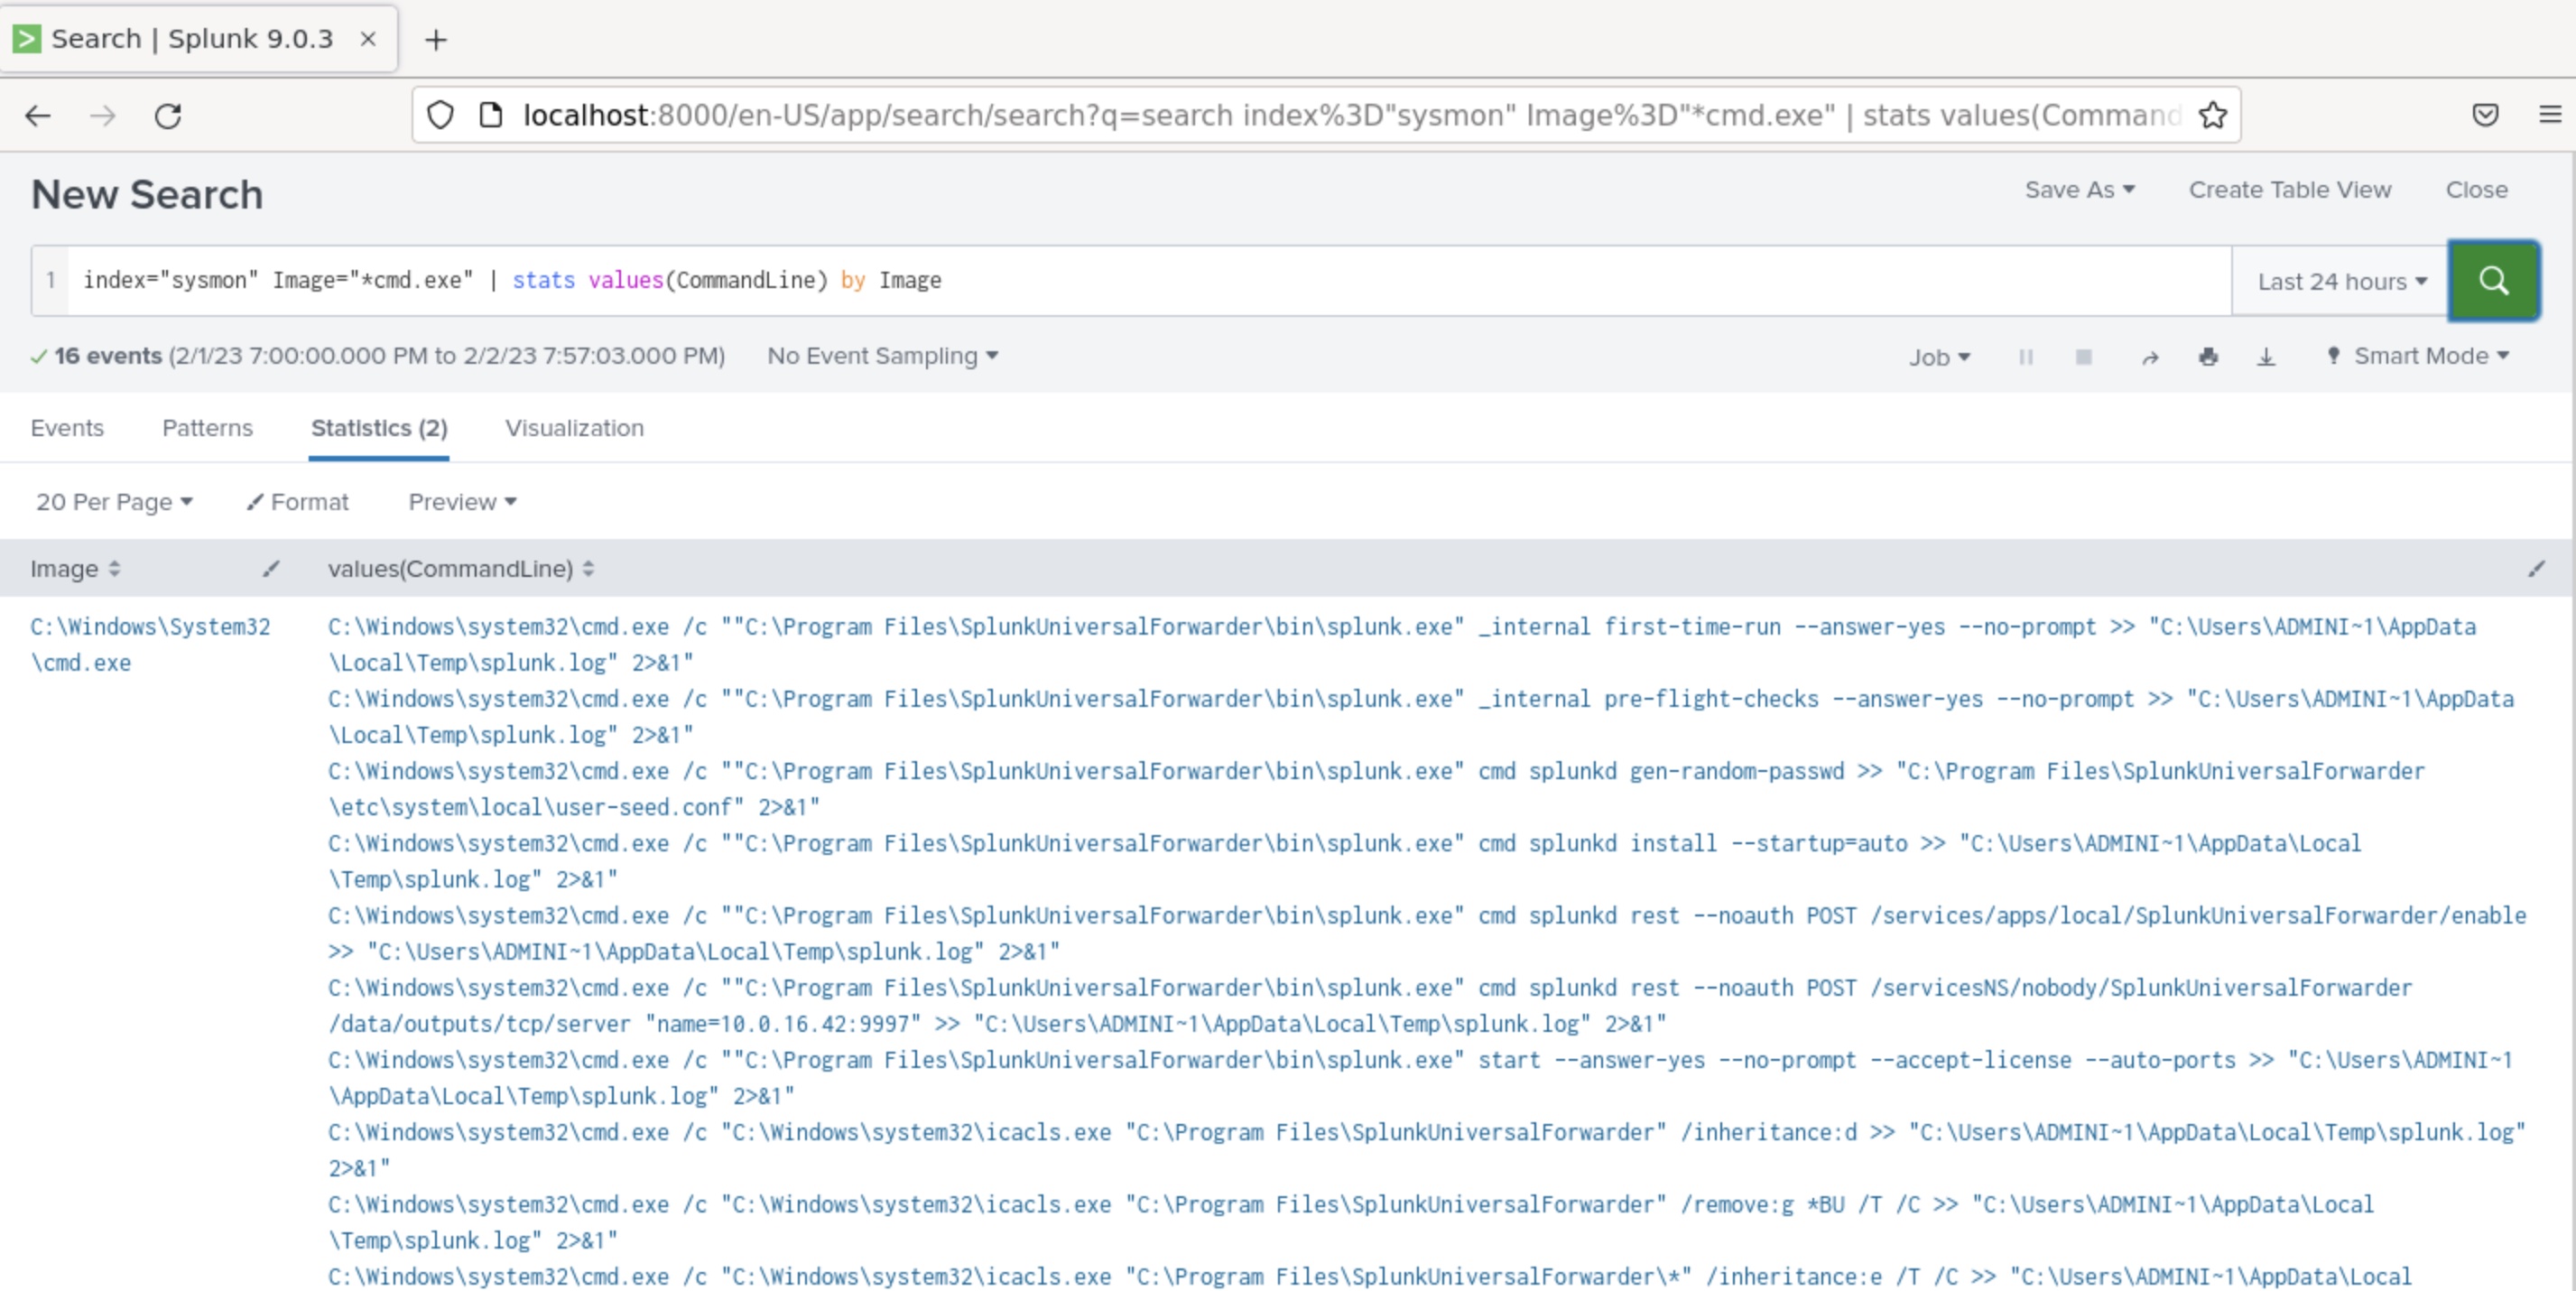
- Identify the longest cmd.exe command that was executed
Step 18: You can identify the longest cmd.exe command that was executed (overly long commands are often suspicious) by using the following query:
index="sysmon" Image="*cmd.exe" | eval len=len(CommandLine) | table len, CommandLine | sort -len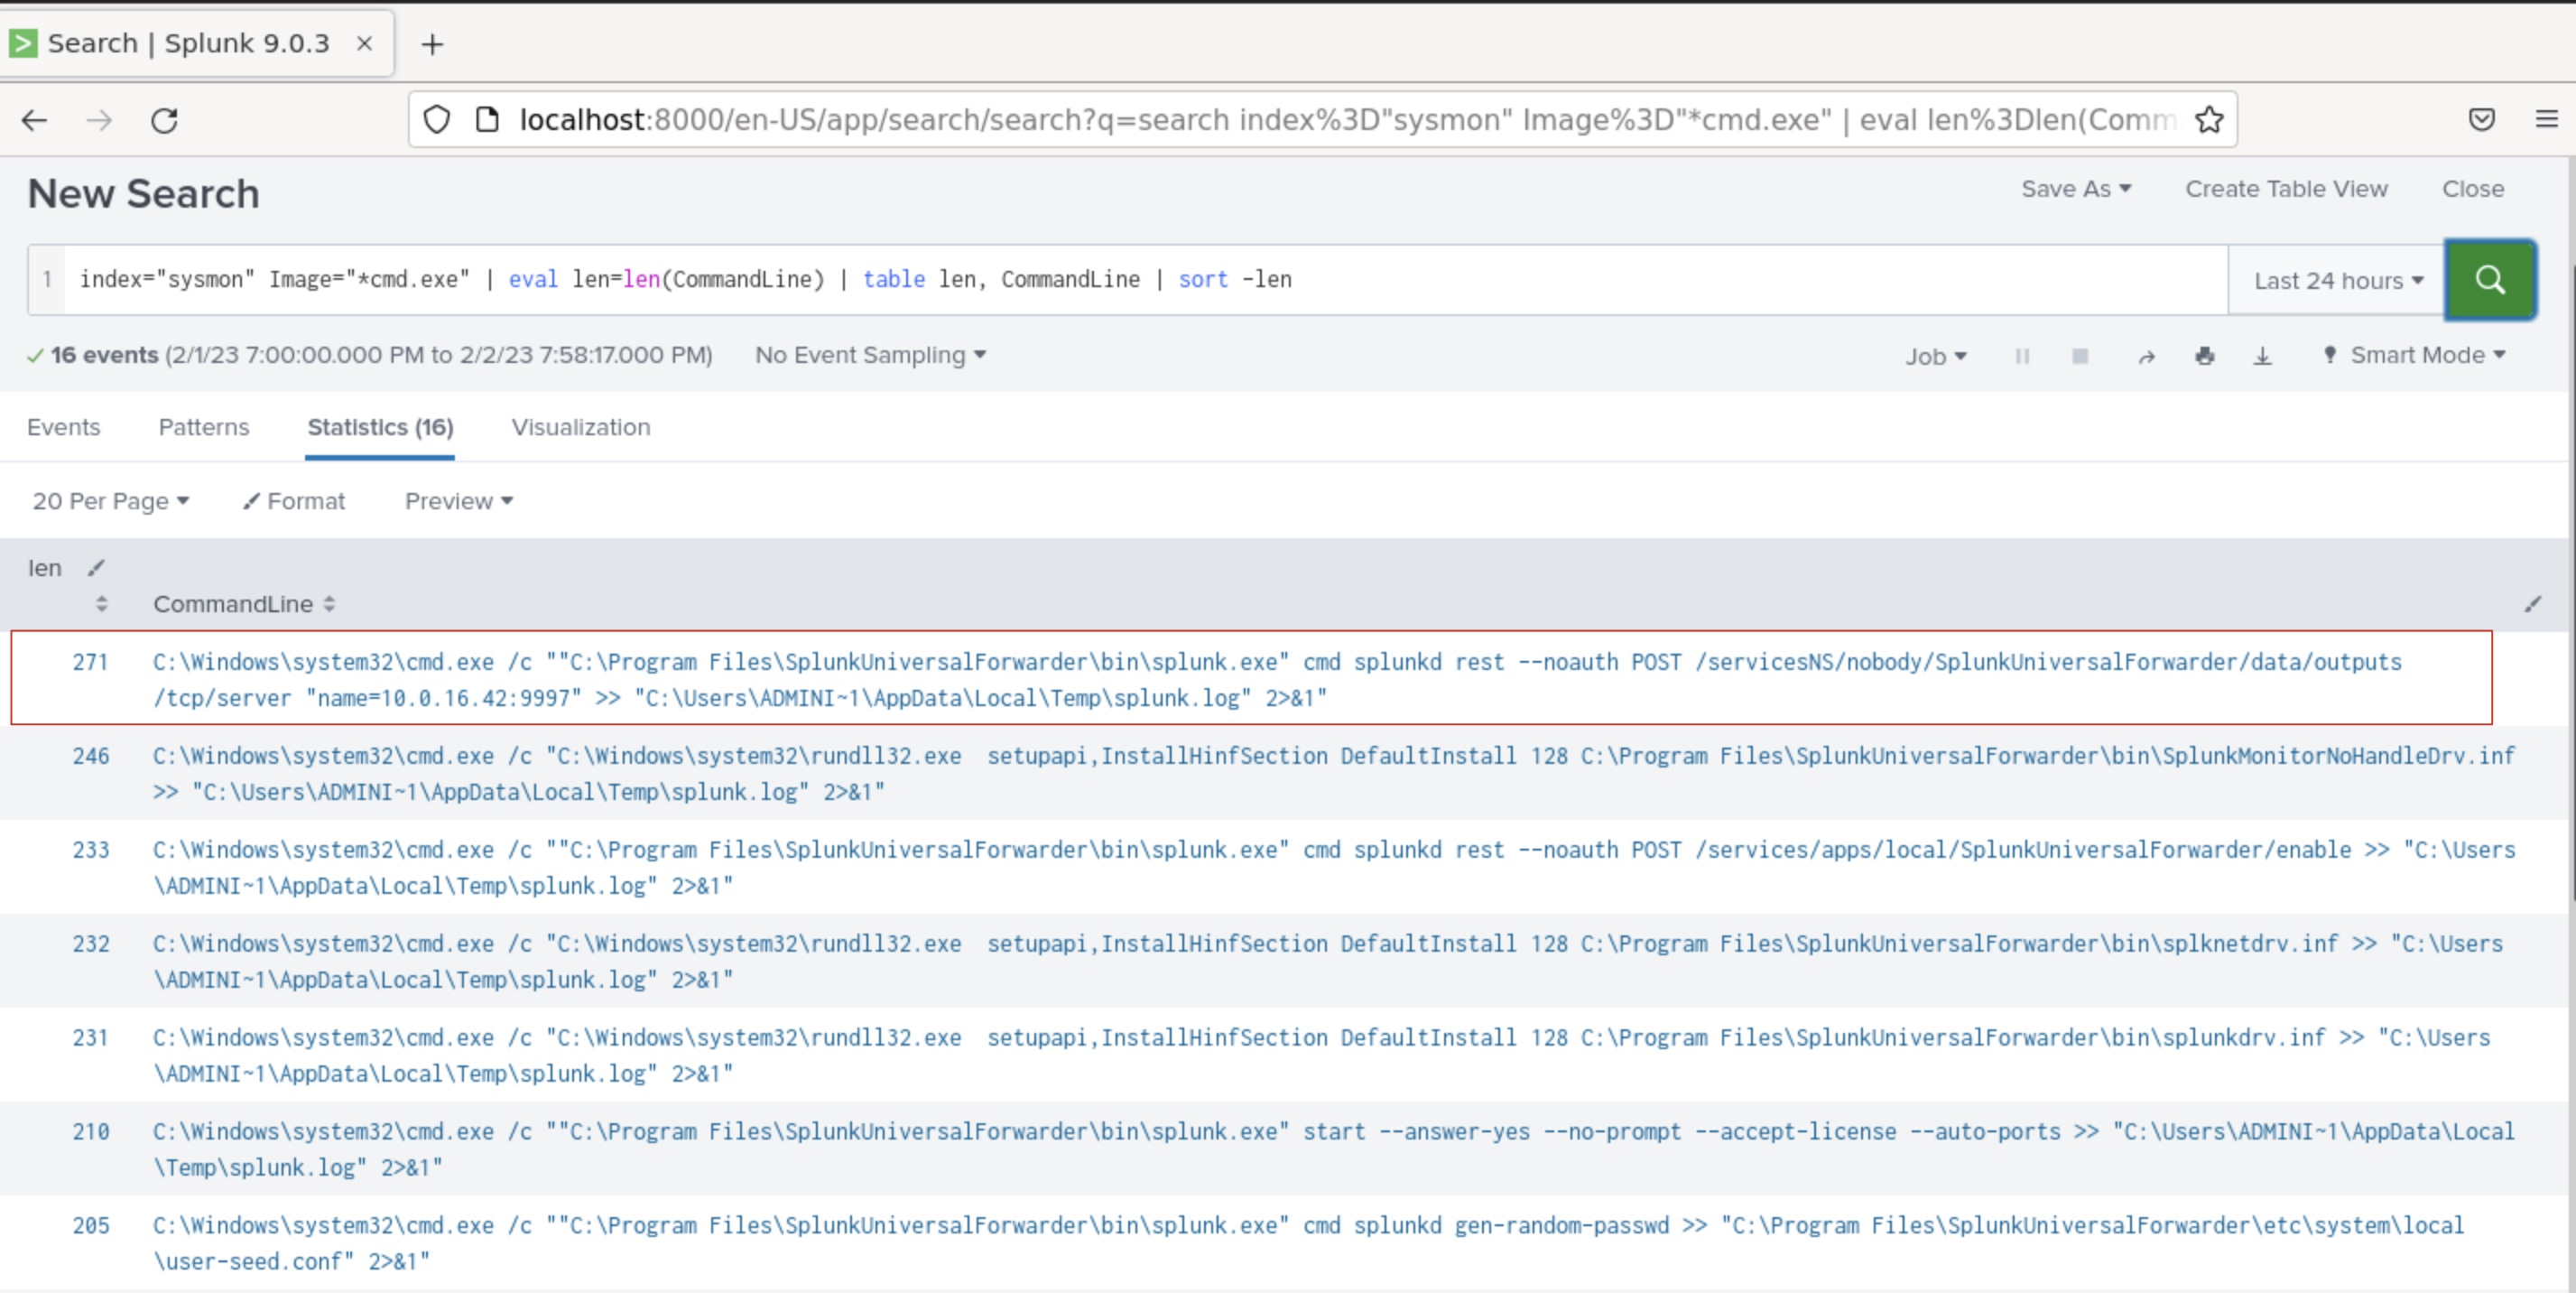
Task 4: Run T1518.001-5 (Sysmon Service Discovery) atomic test and detect its activity.
Step 19: First, you need to import the Atomic Red Team (ART) module. The following command imports the Invoke-AtomicTest function each time a new instance of ART is started in PowerShell:
Command:
Import-Module "C:\AtomicRedTeam\invoke-atomicredteam\Invoke-AtomicRedTeam.psd1" -Force
Step 20: Let's see the details of the test that we need to run. Use the following command:
Command:
Invoke-AtomicTest T1518.001-5 -ShowDetails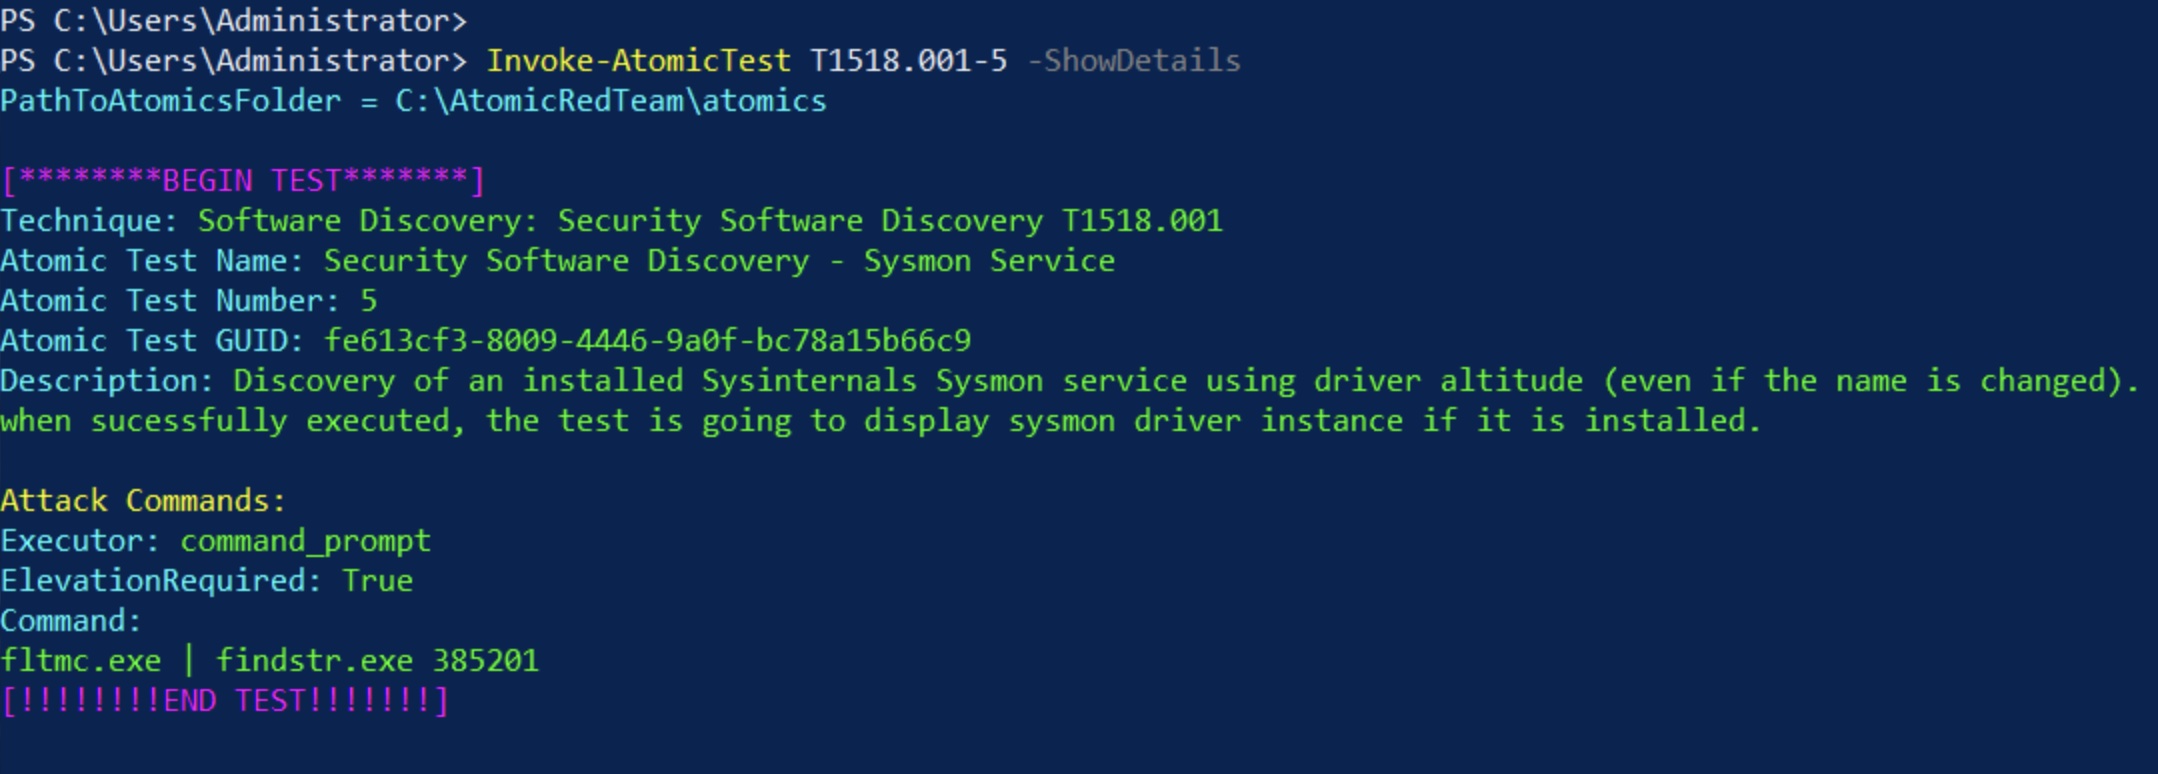
As per the description, this test will perform discovery of an installed Sysinternals Sysmon service using driver altitude (even if the name is changed). When sucessfully executed, the test is going to display sysmon driver instance if it is installed. The attack command can also be seen here.
Step 21: Run this test.
Command:
Invoke-AtomicTest T1518.001-5
The test was successful.
Step 22: Now, let's try to detect the activity of this test on Splunk. Make sure you are initially viewing all the events first. Now, on the left hand side, you can see list of Selected Fields. Let's add the ParentCommandLine field to it. For this, click on All Fields and simply tick mark the field you want to add.
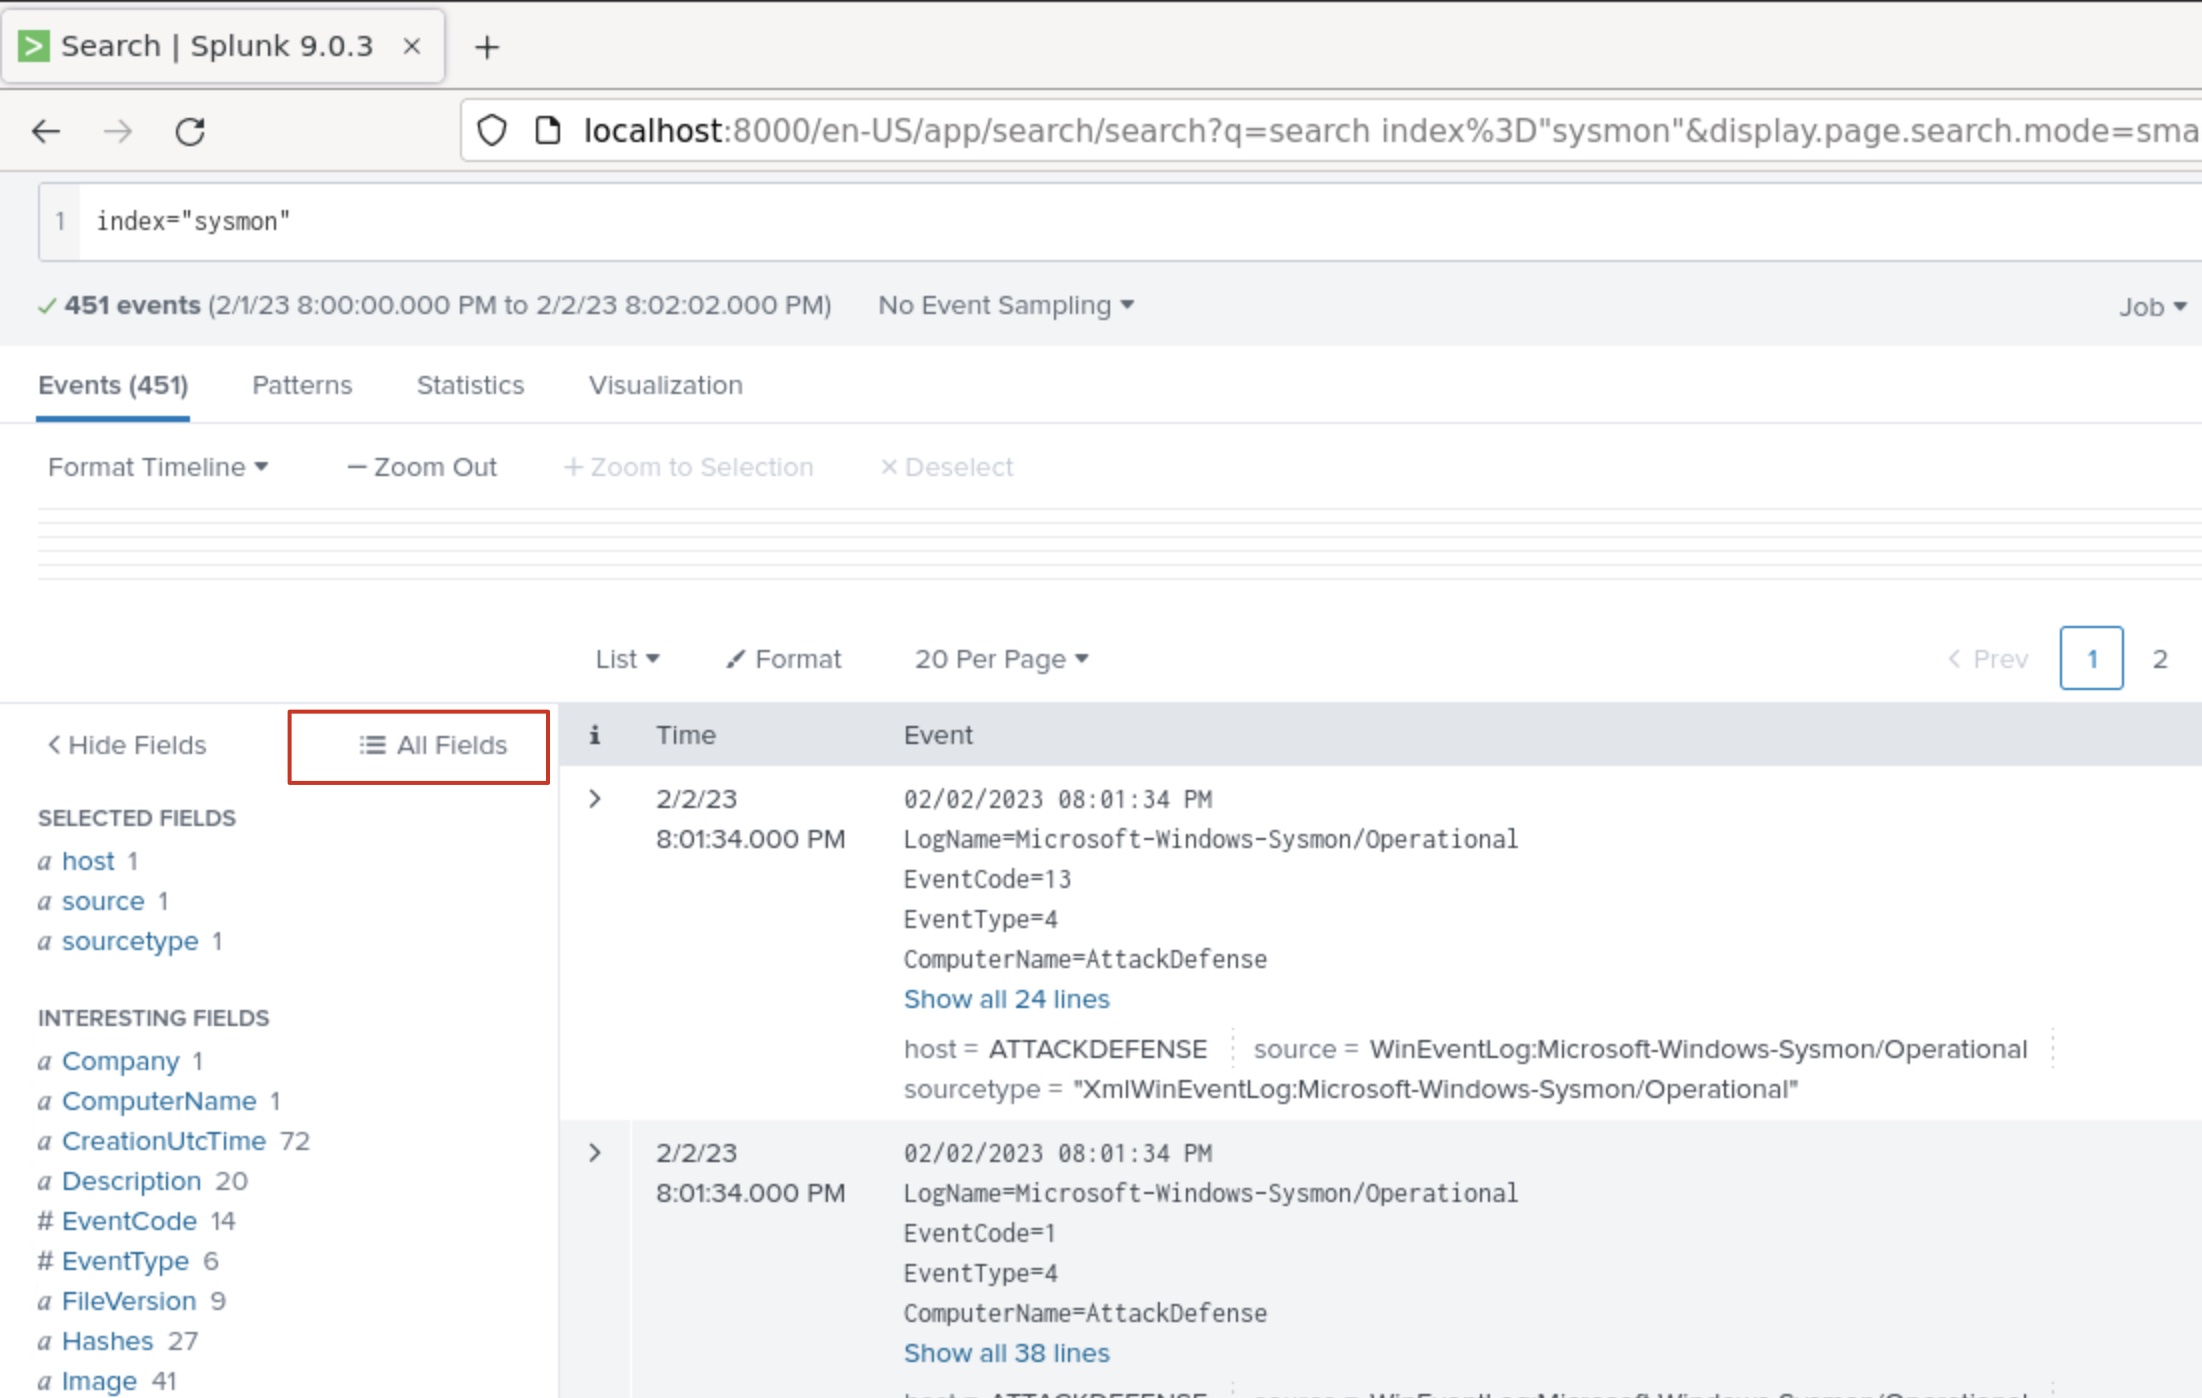
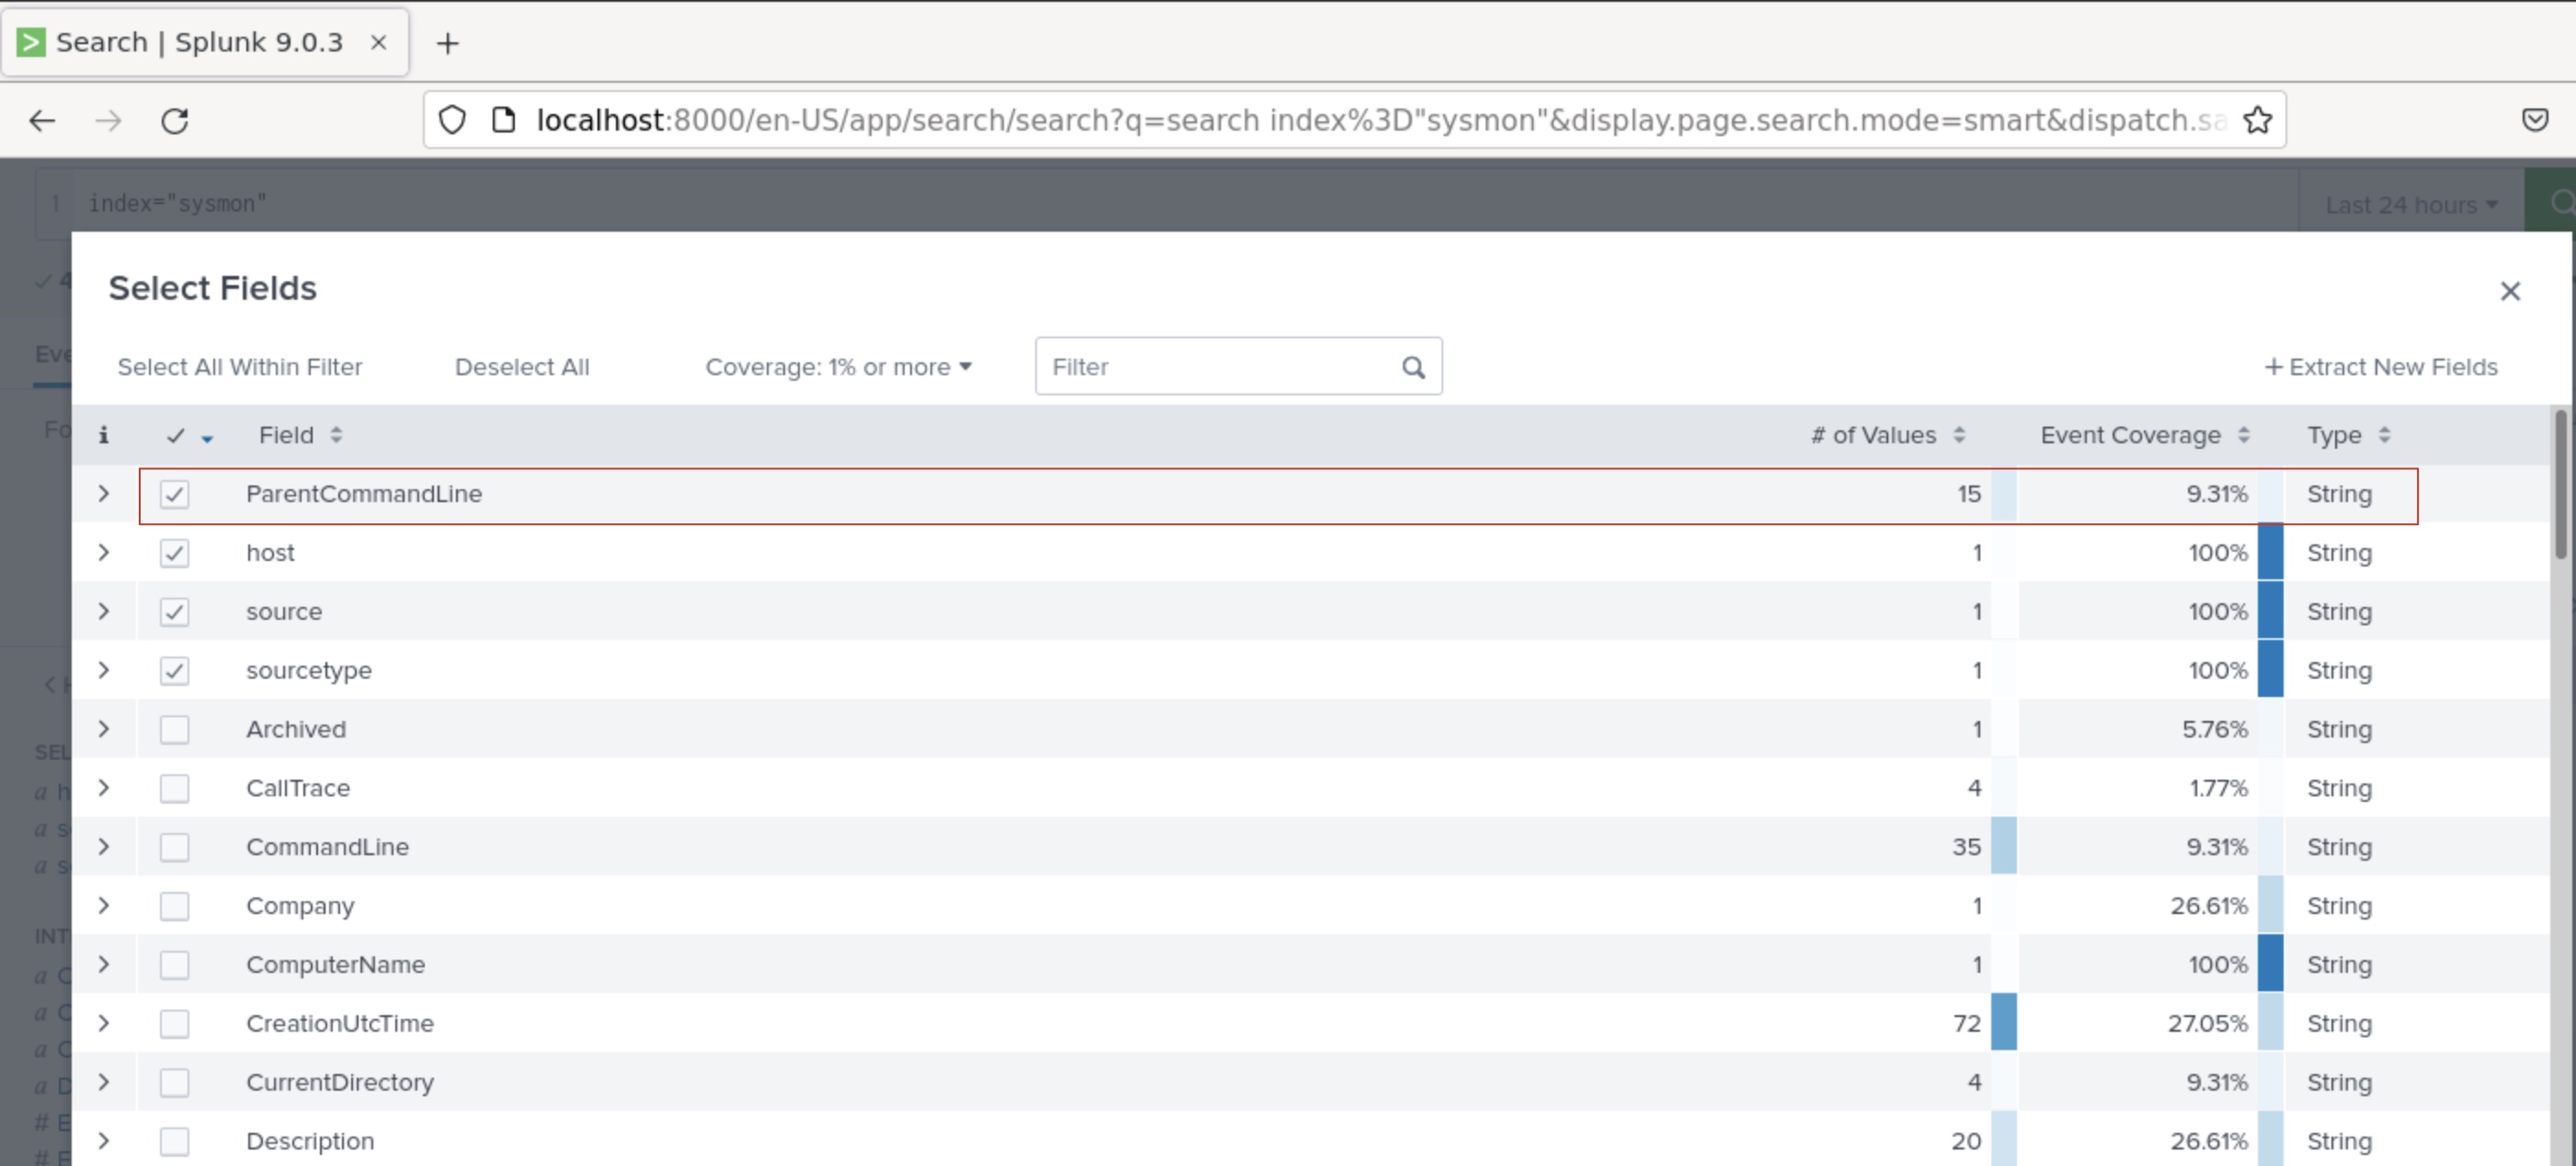
Step 23: Once the ParentCommandLine field is added, click on it to view the top 10 values.
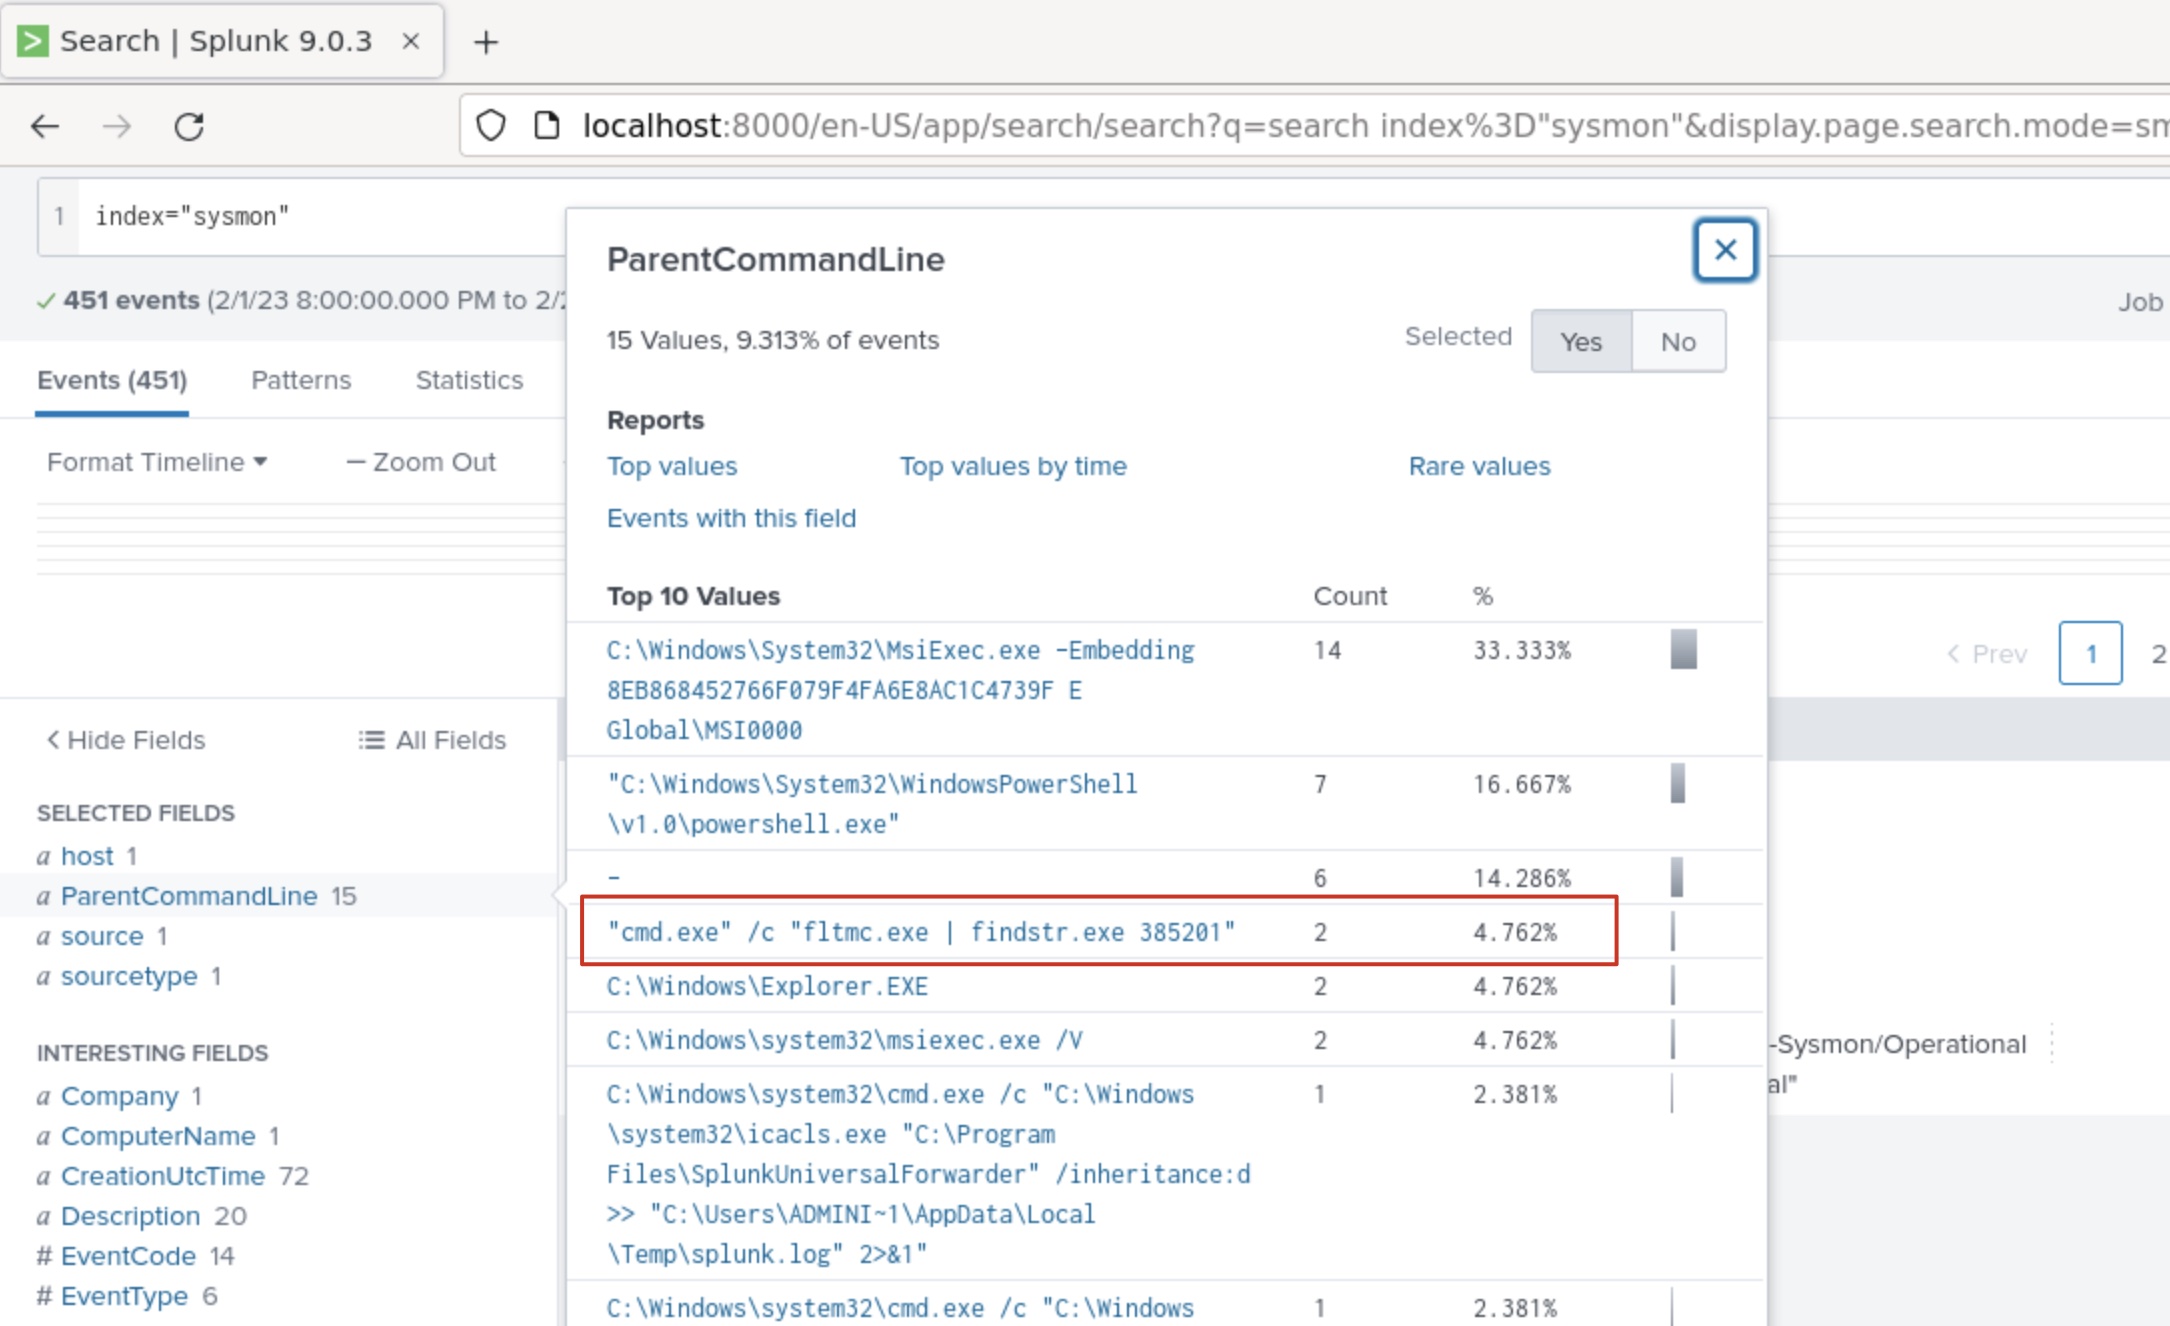
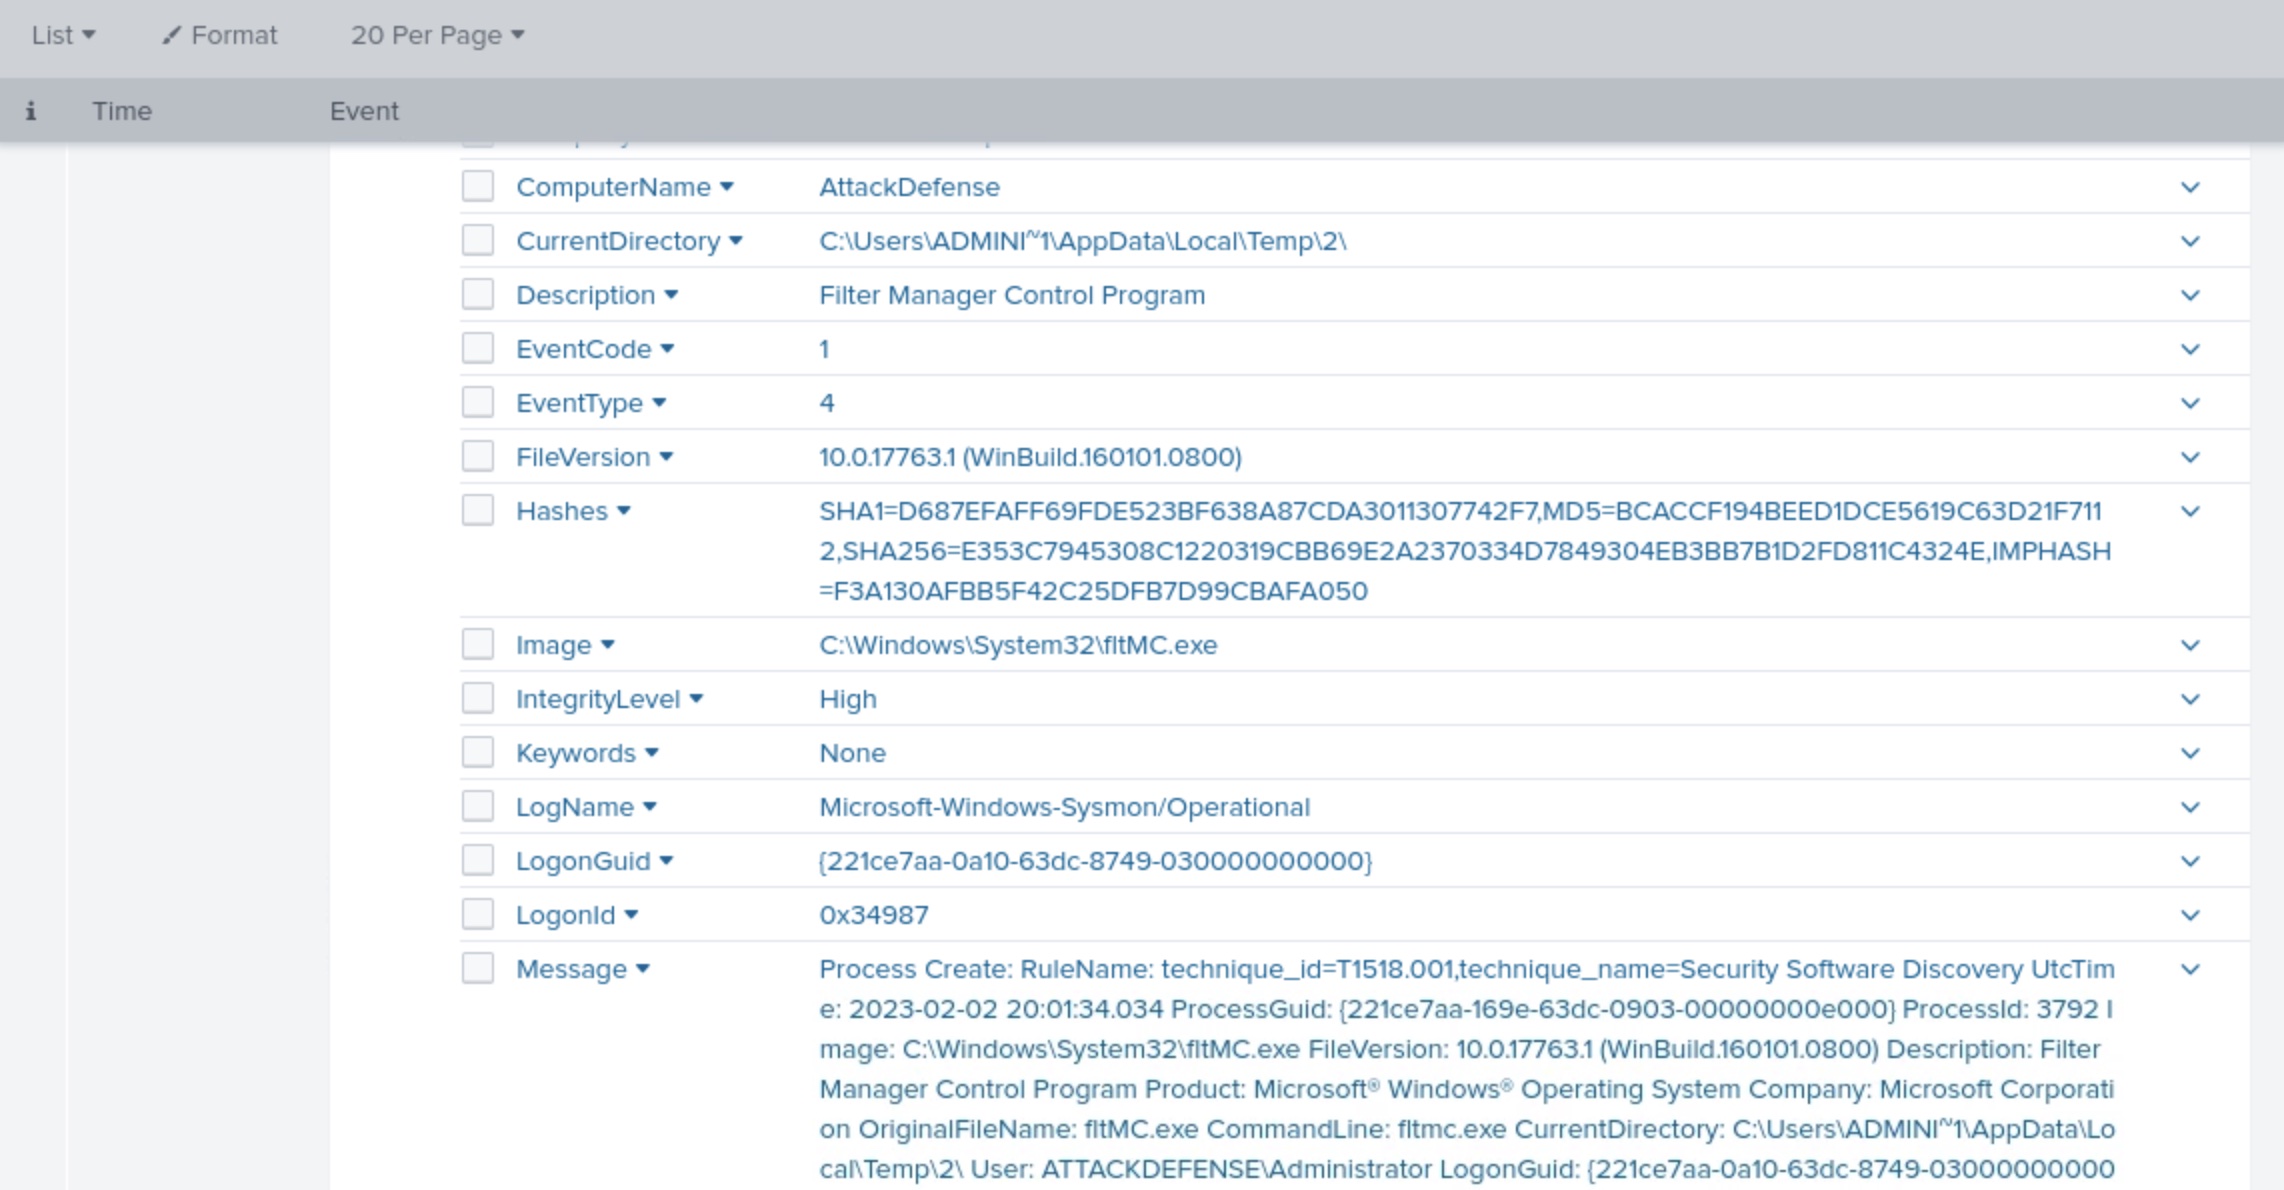
The command highlighted above looks suspicious. This is the attack command that we performed to check if Sysmon is installed or not using the driver altitude. The fltMC.exe program is a system-supplied command line utility for common minifilter driver management operations primarily used by developers and system administrators. Note that the sysmon altitude is always the same - 385201.
Clicking on it would take us to the matching events. Note the query that is executed.
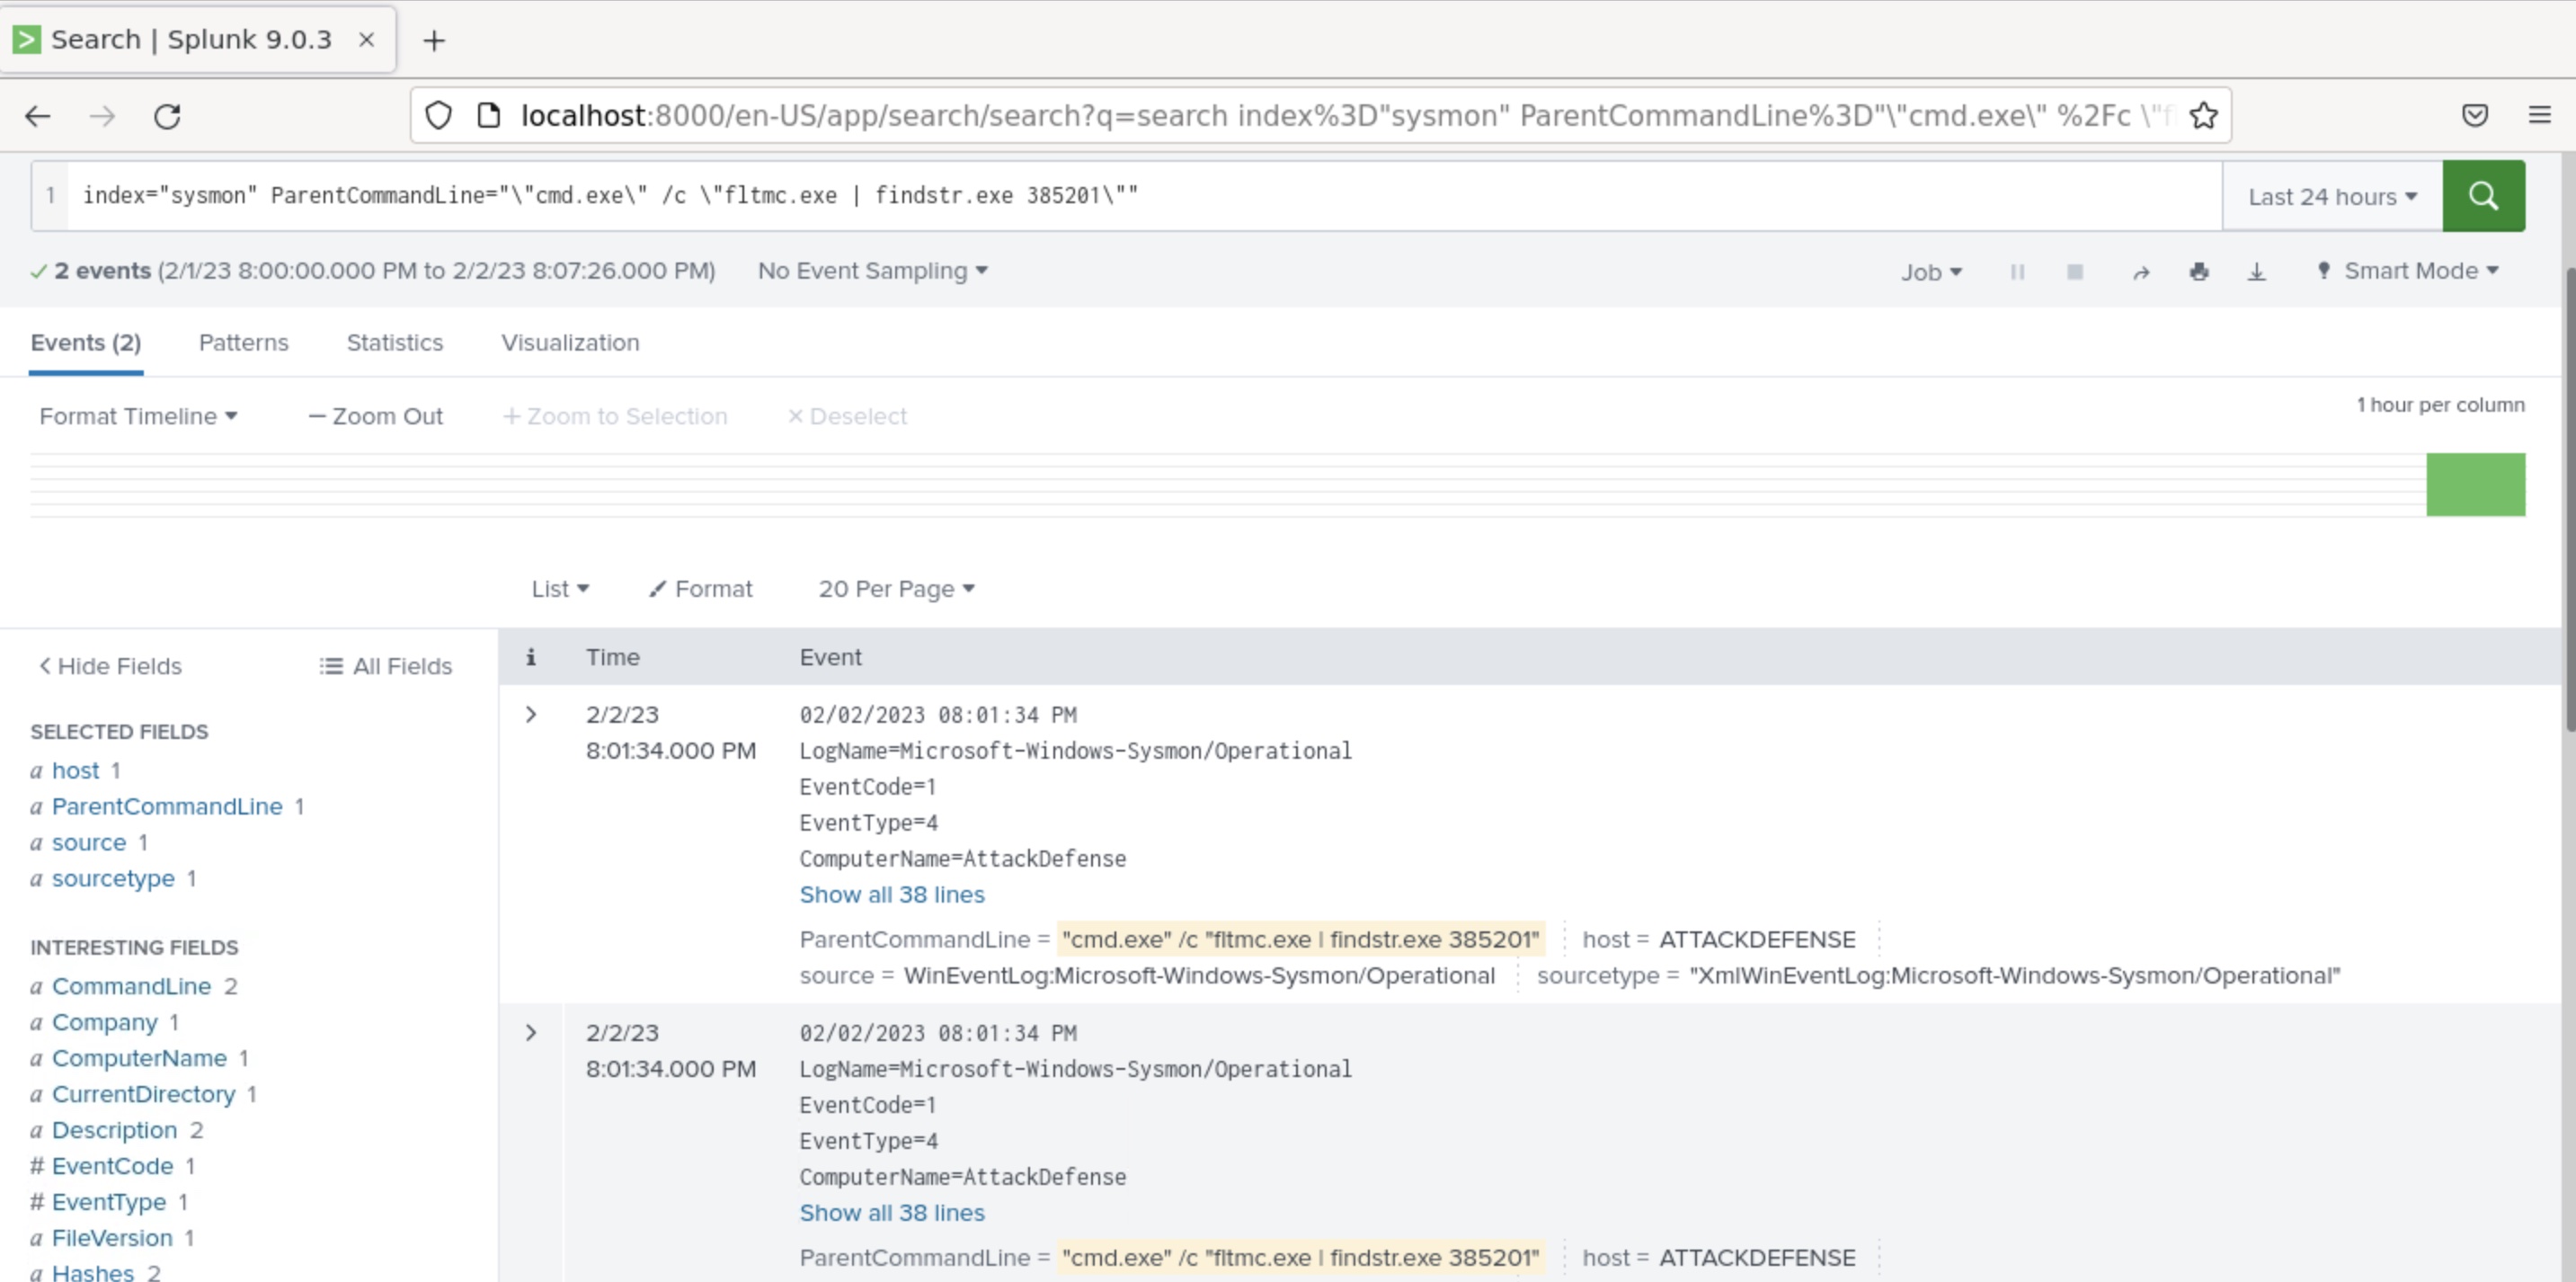
Now, you can expand the events for more information.
Task 5: Run T1547.004-5 (Winlogon HKLM Userinit Key Persistence) atomic test and detect its activity.
Winlogon.exe is a Windows component responsible for actions at logon/logoff as well as handling the secure attention sequence. Adversaries may abuse features of Winlogon to execute DLLs and/or executables when a user logs in. Specifically, the Userinit, Shell and Notify subkeys under Winlogon are known to be vulnerable to abuse.
Reference: https://github.com/redcanaryco/atomic-red-team/blob/master/atomics/T1547.004/T1547.004.md
Step 24: Let's see the details of the test that we need to run. Use the following command:
Command:
Invoke-AtomicTest T1547.004-5 -ShowDetails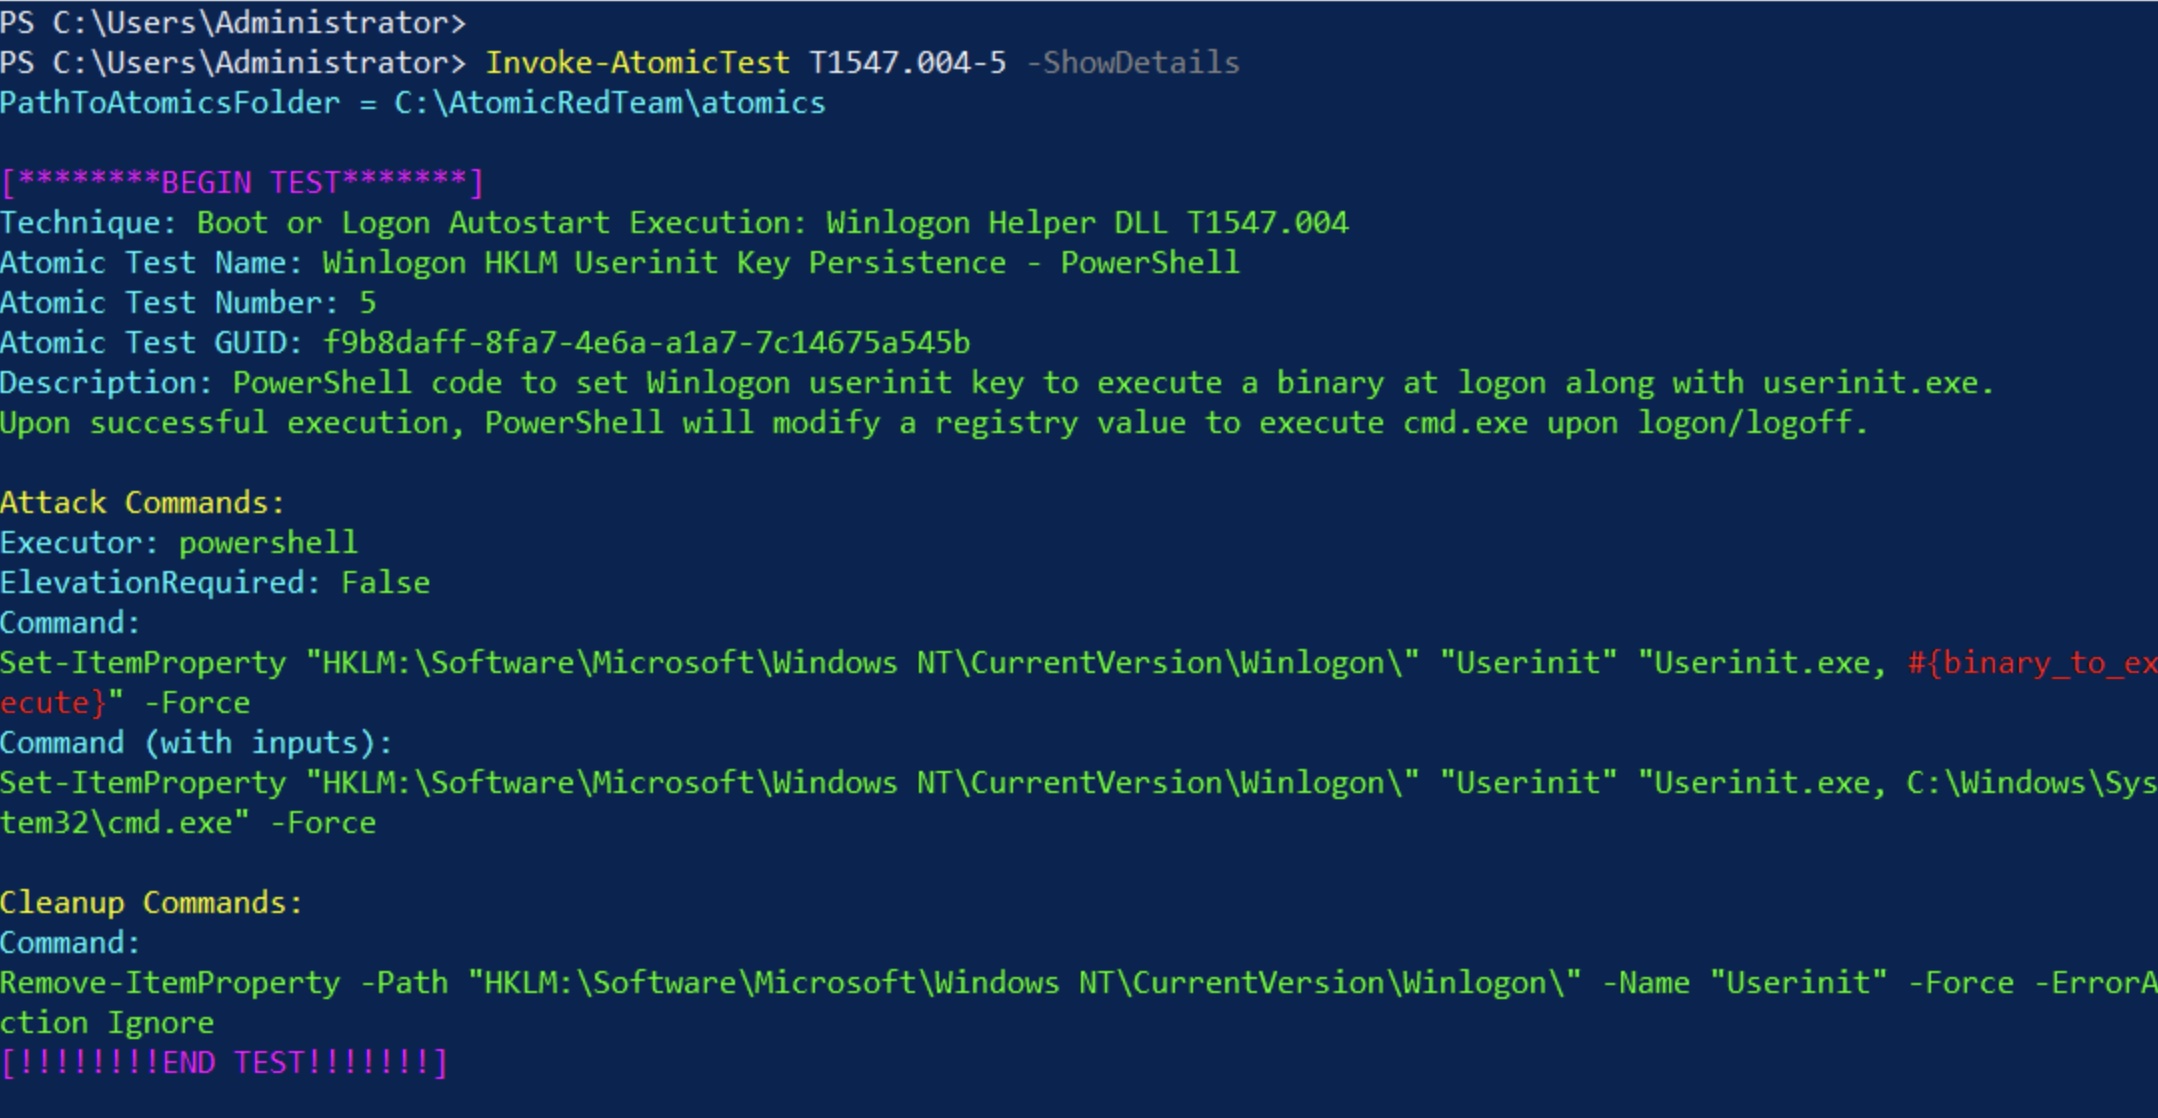
The Winlogon Userinit registry key typically points to userinit.exe, the user initialization program that is executed when a user logs on. This test would set Winlogon Userinit key to execute a binary at logon along with userinit.exe. This could be a malicious executable allowing an attacker to gain persistence. However, in this case, it is only cmd.exe.
Step 25: Run this test.
Command:
Invoke-AtomicTest T1547.004-5
The test was successful.
Step 26: Now let's go to Splunk detect the activity of this. Let's try to list all the executed commands associated with the powershell.exe process. Run the following query:
index="sysmon" Image="*powershell.exe" | stats values(CommandLine) by Image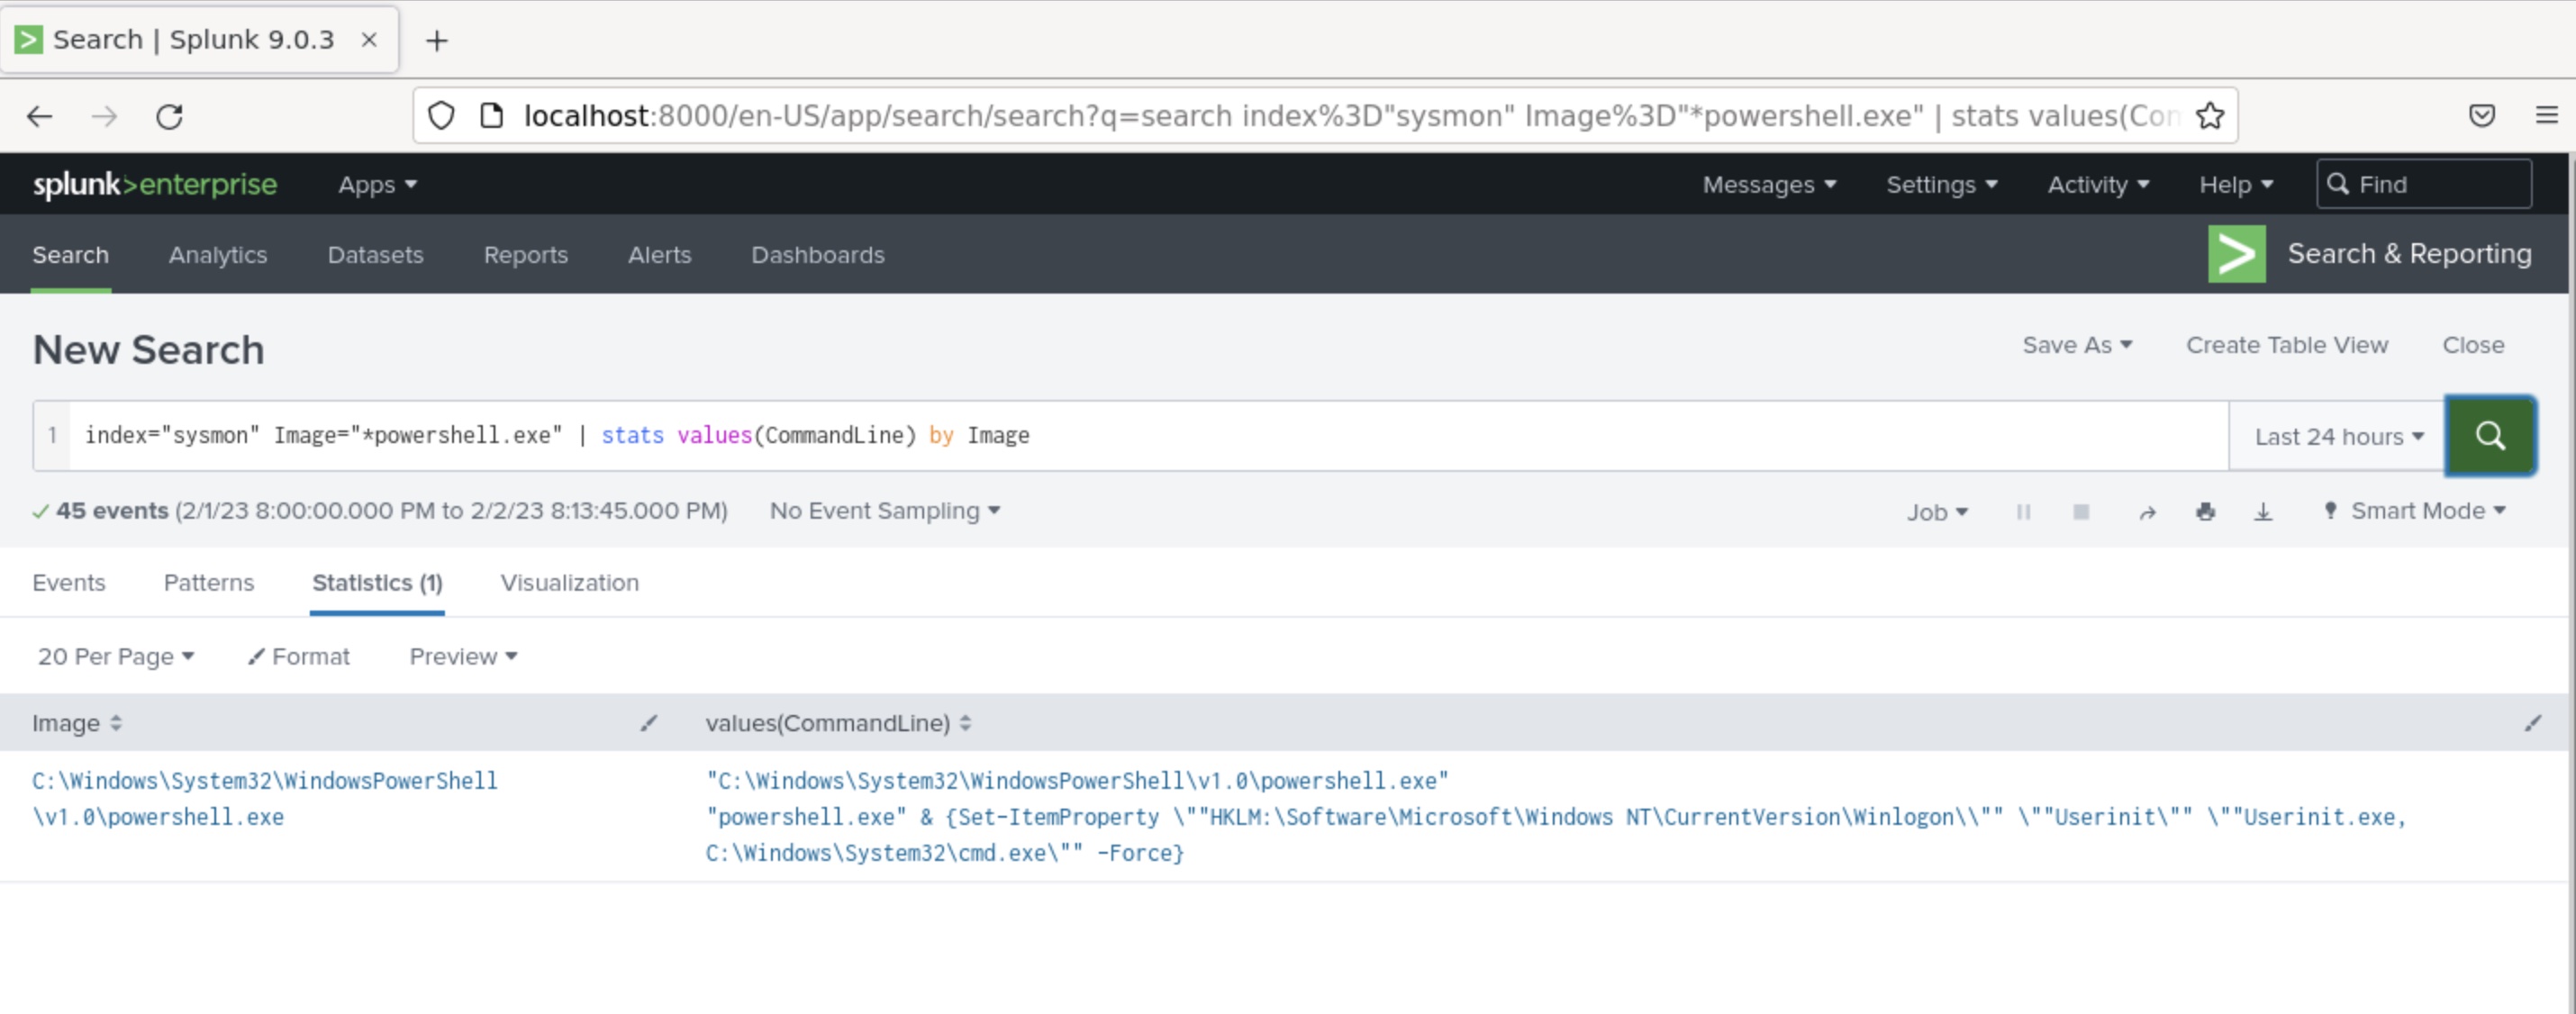
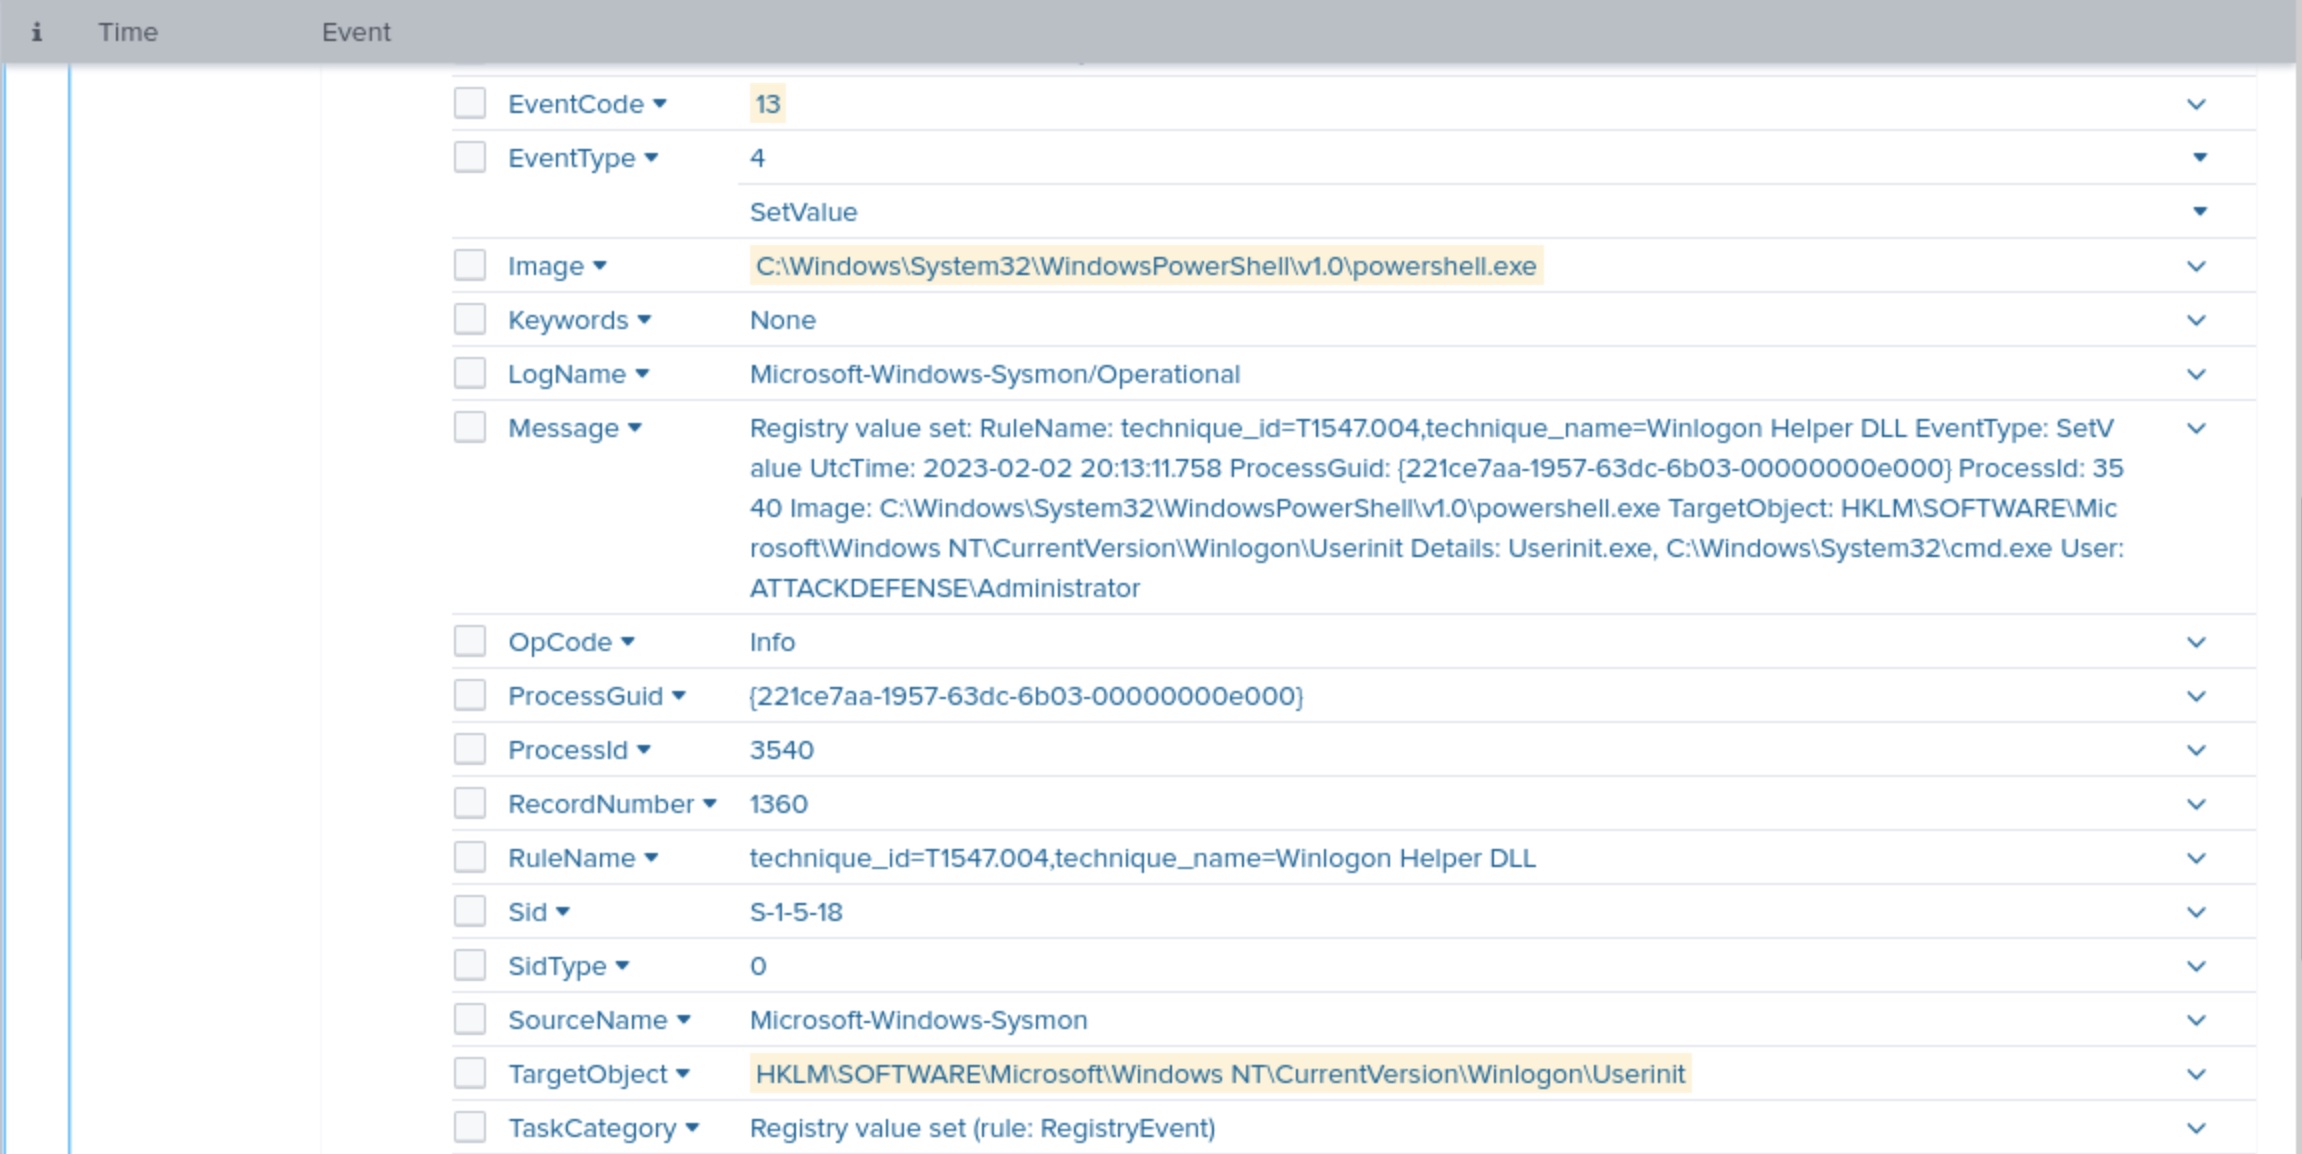
We found the exact activity that took place. It is clear that the Winlogon Userinit registry key was modified to execute cmd.exe along with userinit.exe at logon. So, now we know what the target object was. We also know that an event ID of 13 would have been generated as a registry value was set. Let's try to put these in our query to get to the event.
index="sysmon" Image="*powershell.exe" TargetObject="*Userinit" EventCode=13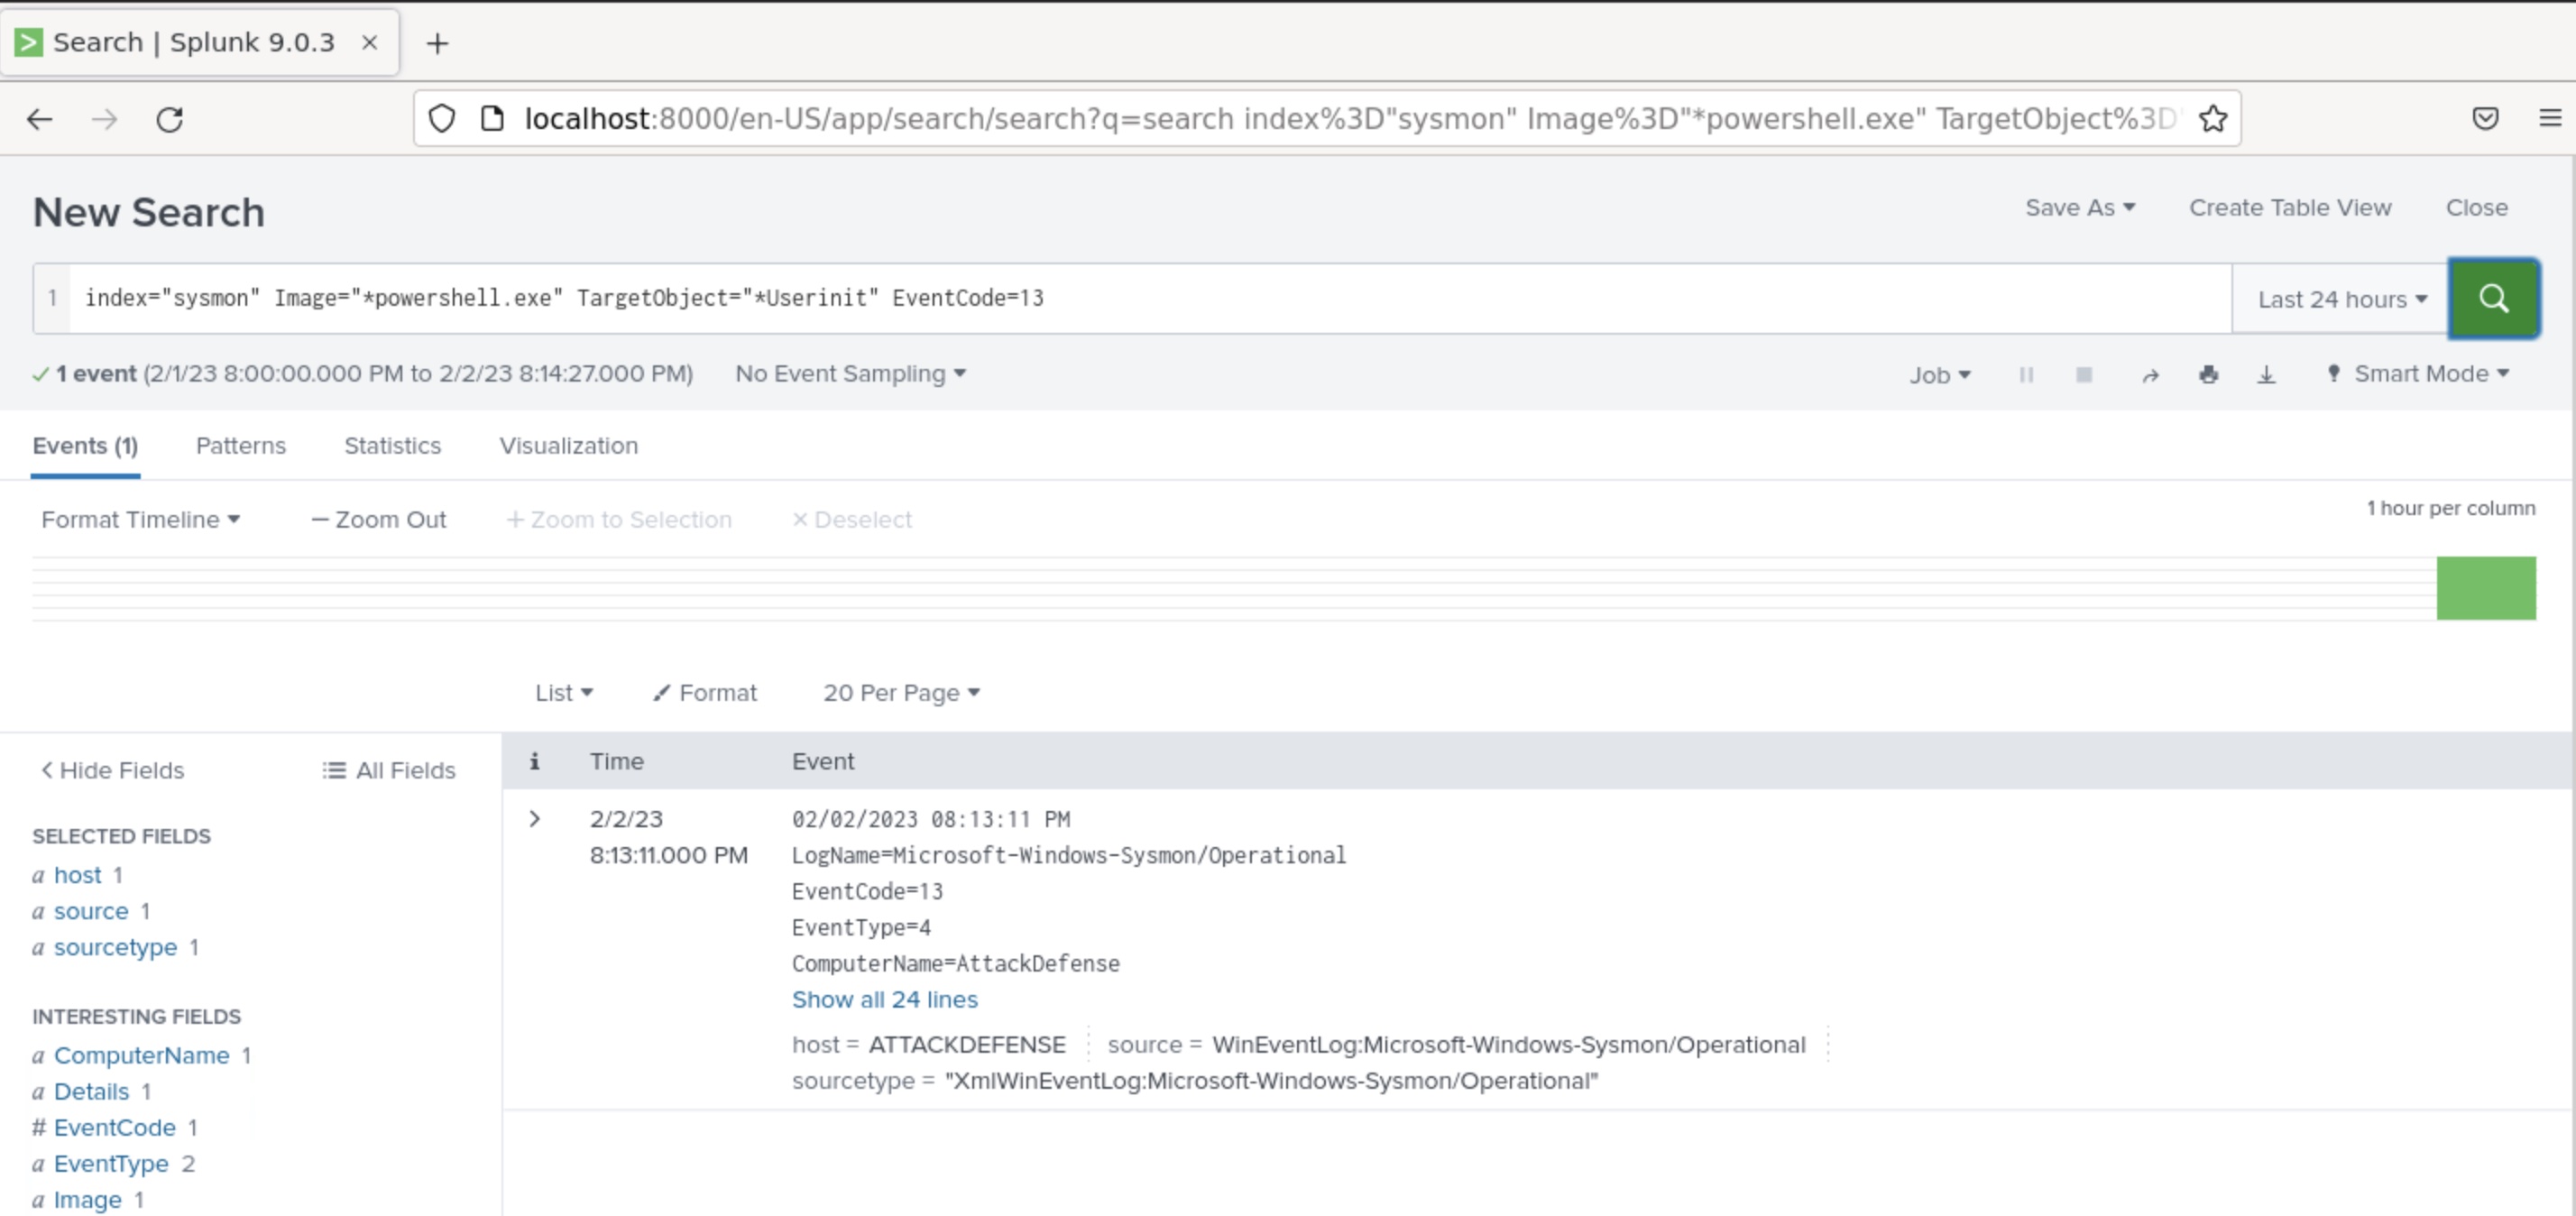
We go the exact event. Expand it to see more information.
Task 6: Run T1047-1,2 (WMI Reconnaissance Users and Processes) atomic tests and detect their activity.
Windows Management Instrumentation (WMI) is an administration feature that provides a uniform environment to access Windows system components. An adversary can use WMI to interact with local and remote systems and use it as a means to execute various behaviors, such as gathering information for Discovery as well as remote Execution of files as part of Lateral Movement.
Reference: https://github.com/redcanaryco/atomic-red-team/blob/master/atomics/T1047/T1047.md
Step 27: Let's see the details of the tests that we need to run one by one. Use the following command:
Command:
Invoke-AtomicTest T1047-1 -ShowDetails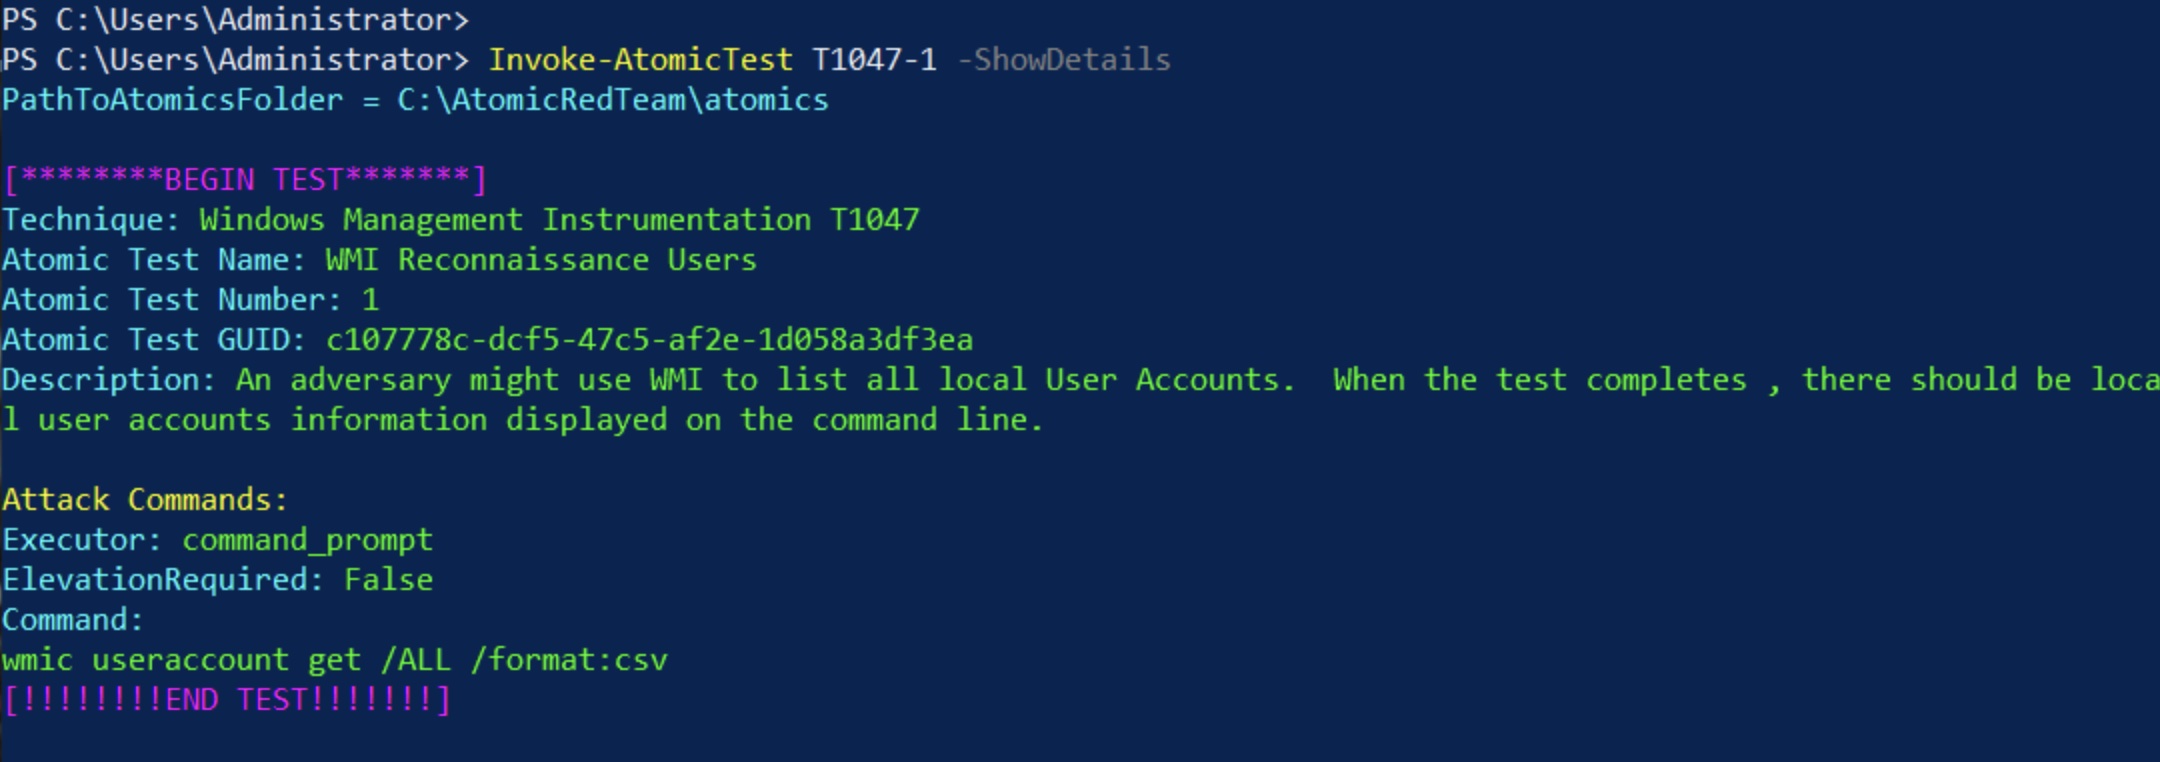
This test will make use of WMI to list all local user accounts. The attack command is also given here. Let's look at test 2.
Command:
Invoke-AtomicTest T1047-2 -ShowDetails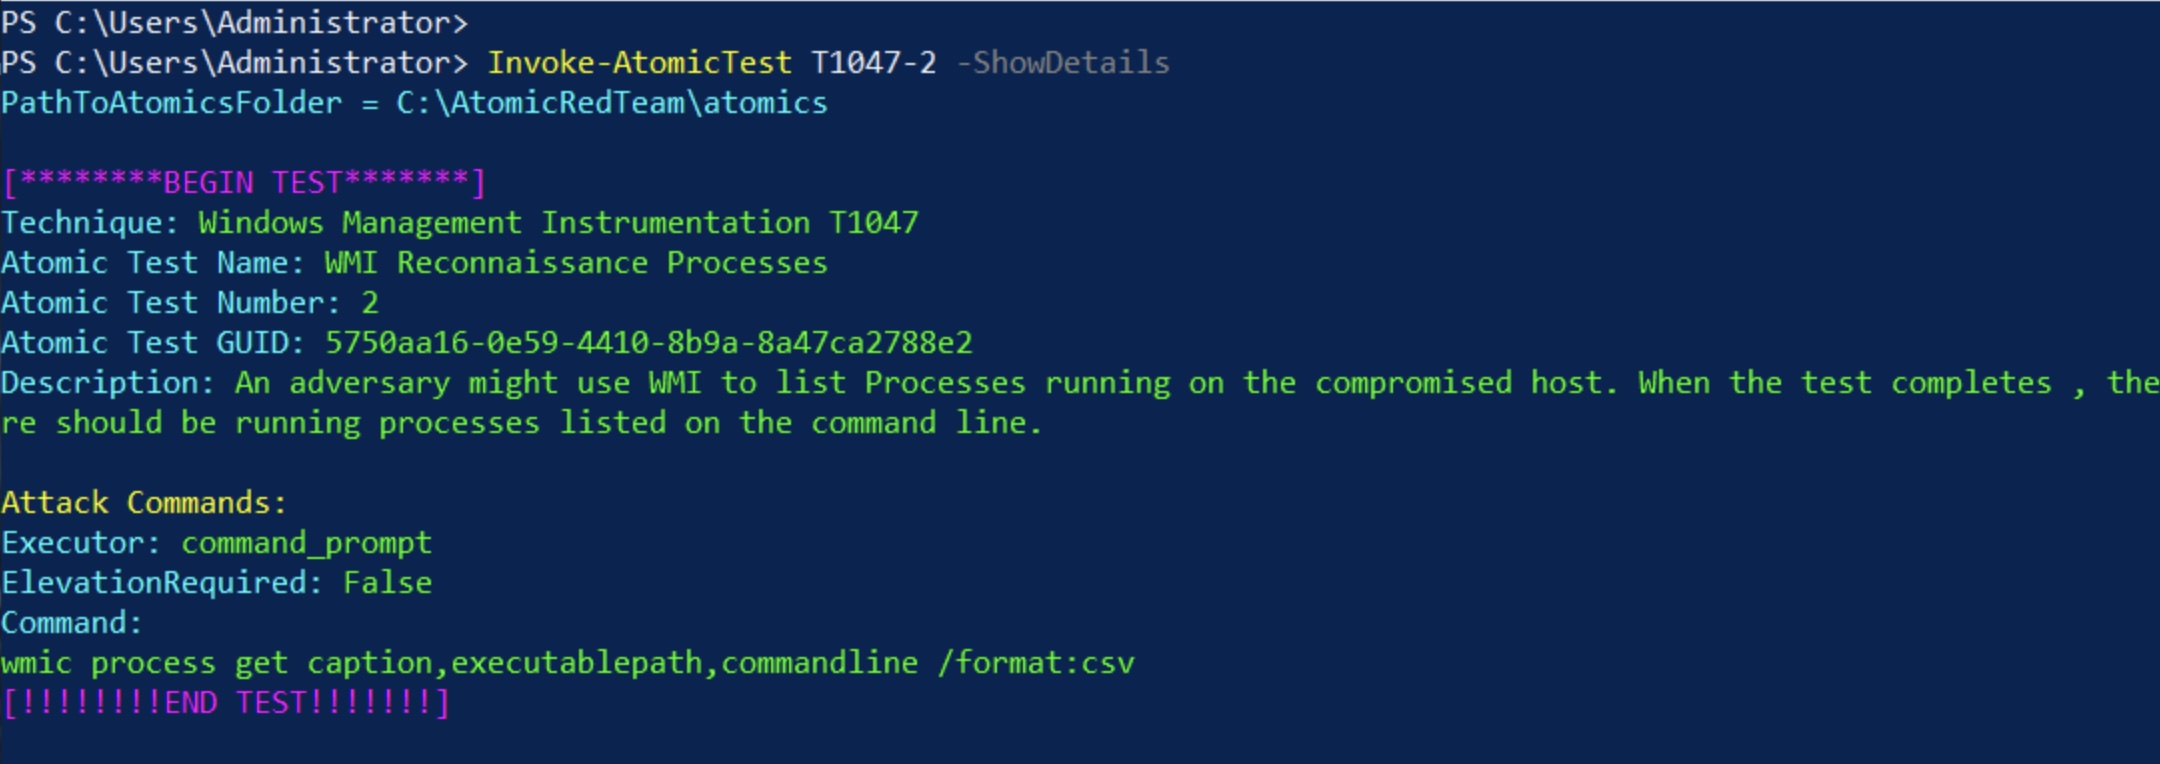
This test will make use of WMI to list running processes. The attack command is also given here.
Step 28: Let's run test 1.
Command:
Invoke-AtomicTest T1047-1 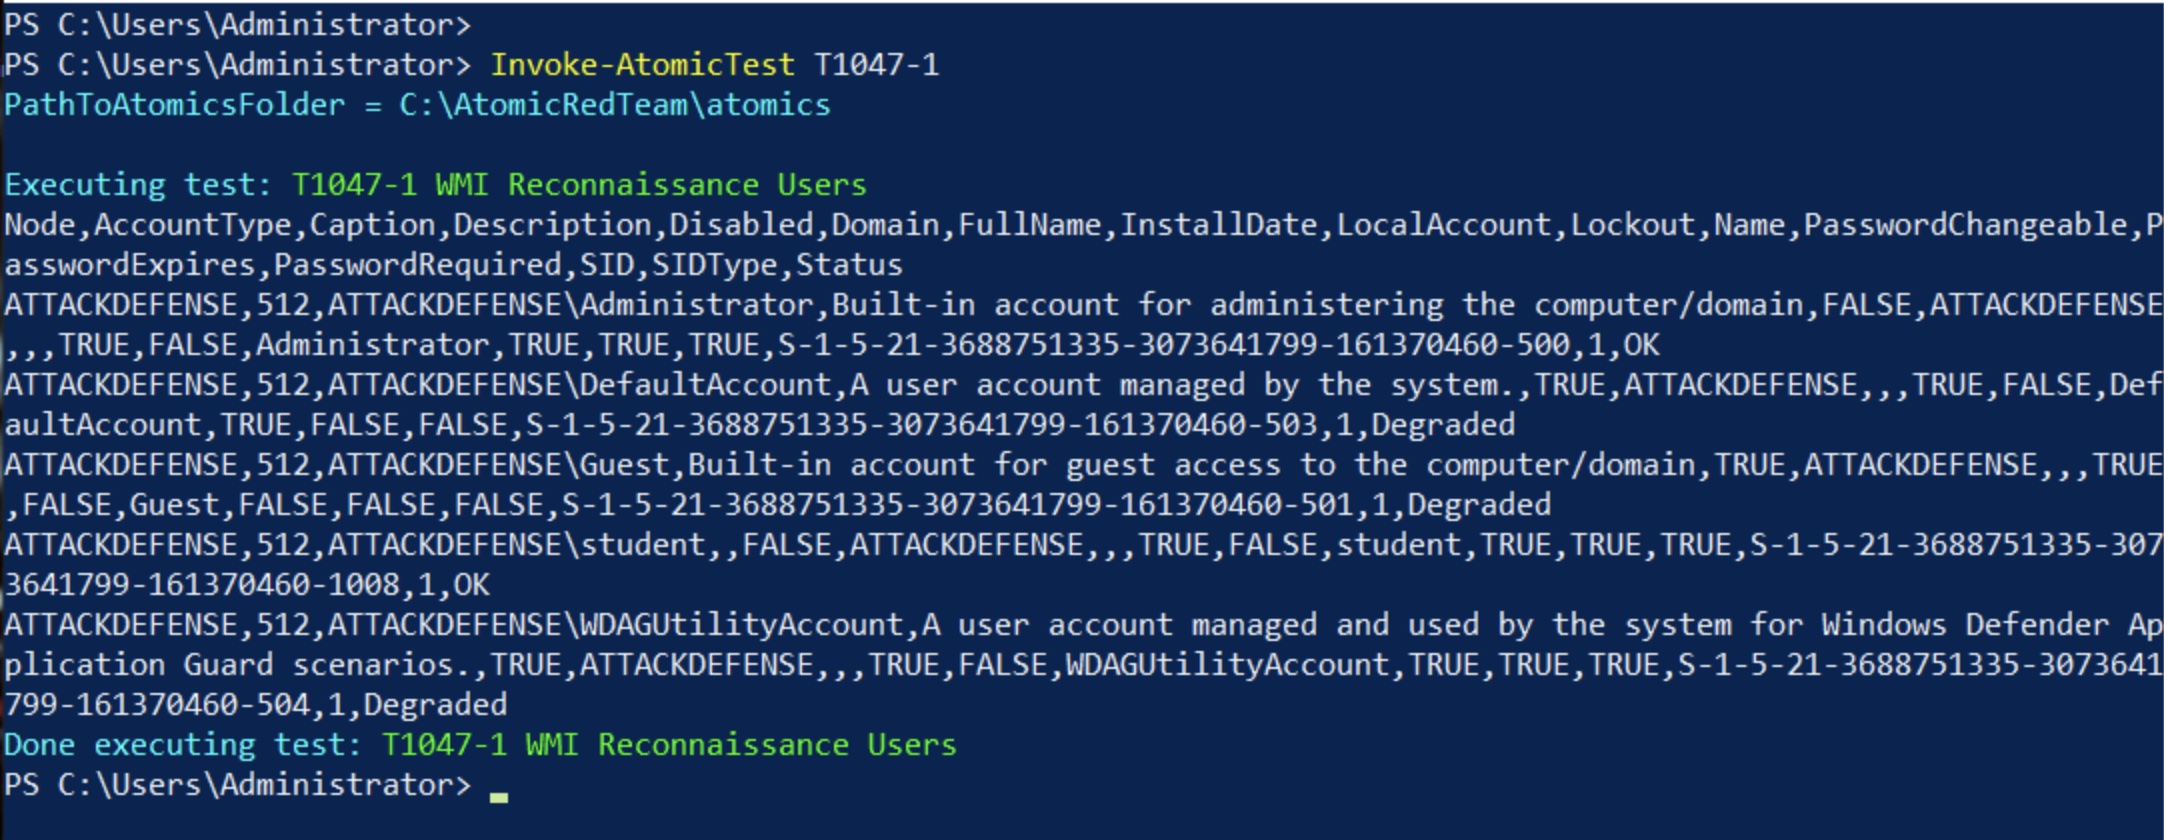
The test was successful.
Step 29: Let's run test 2.
Command:
Invoke-AtomicTest T1047-2 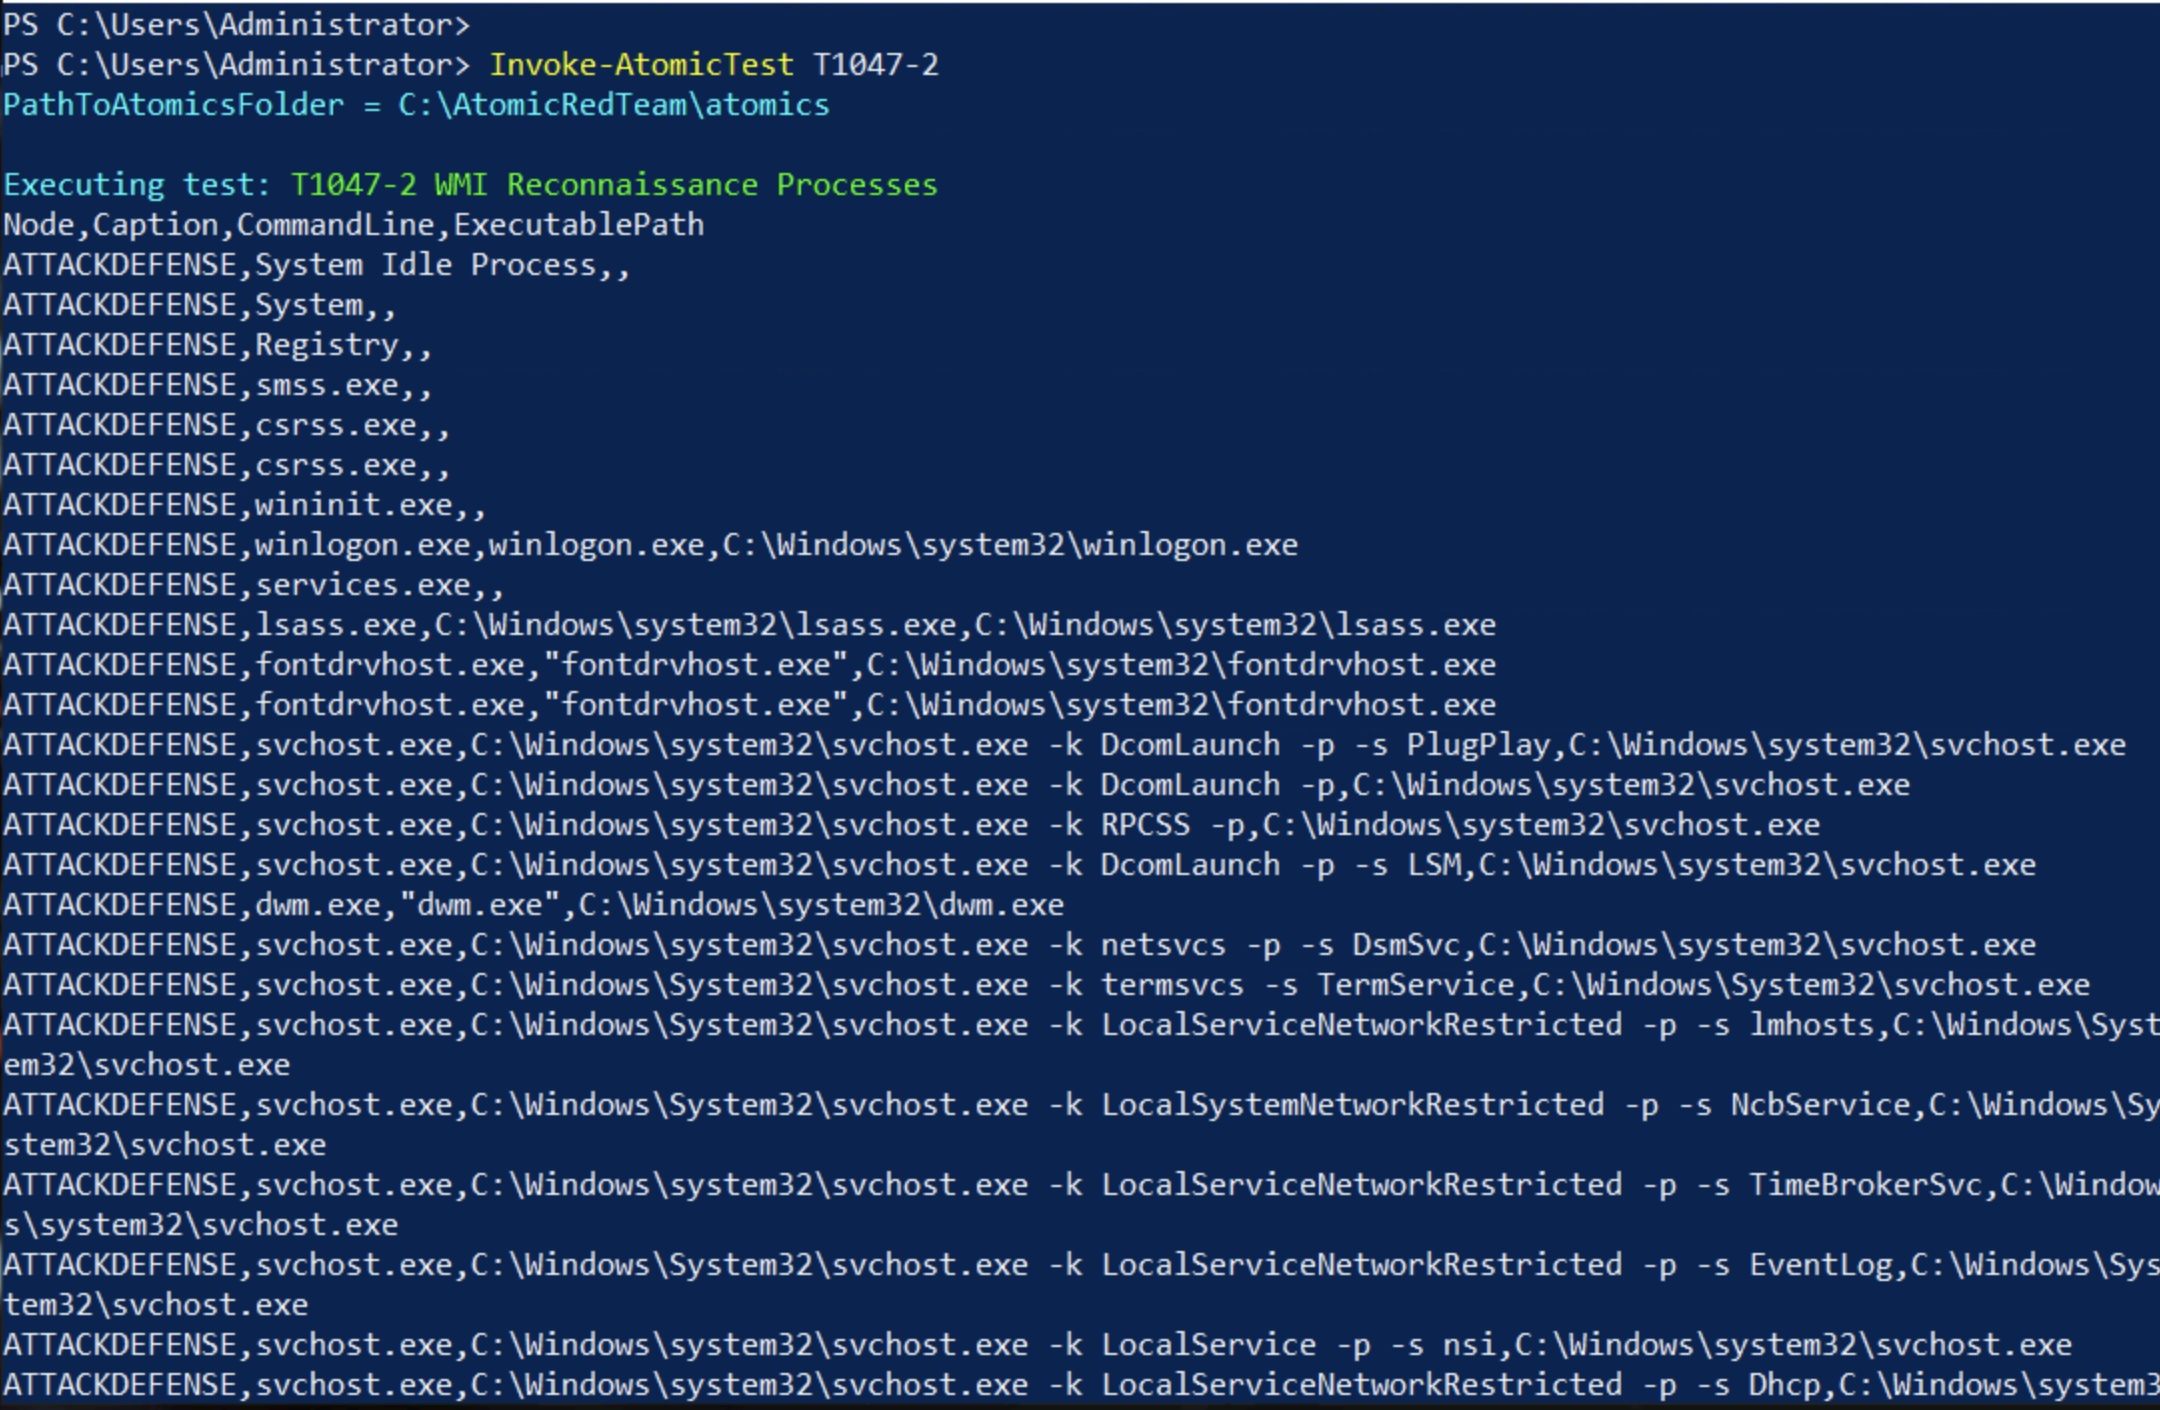
The test was successful.
Step 30: Let's try to detect these activities on Splunk. There can be mutliple ways to do it. Let's try to use the following query:
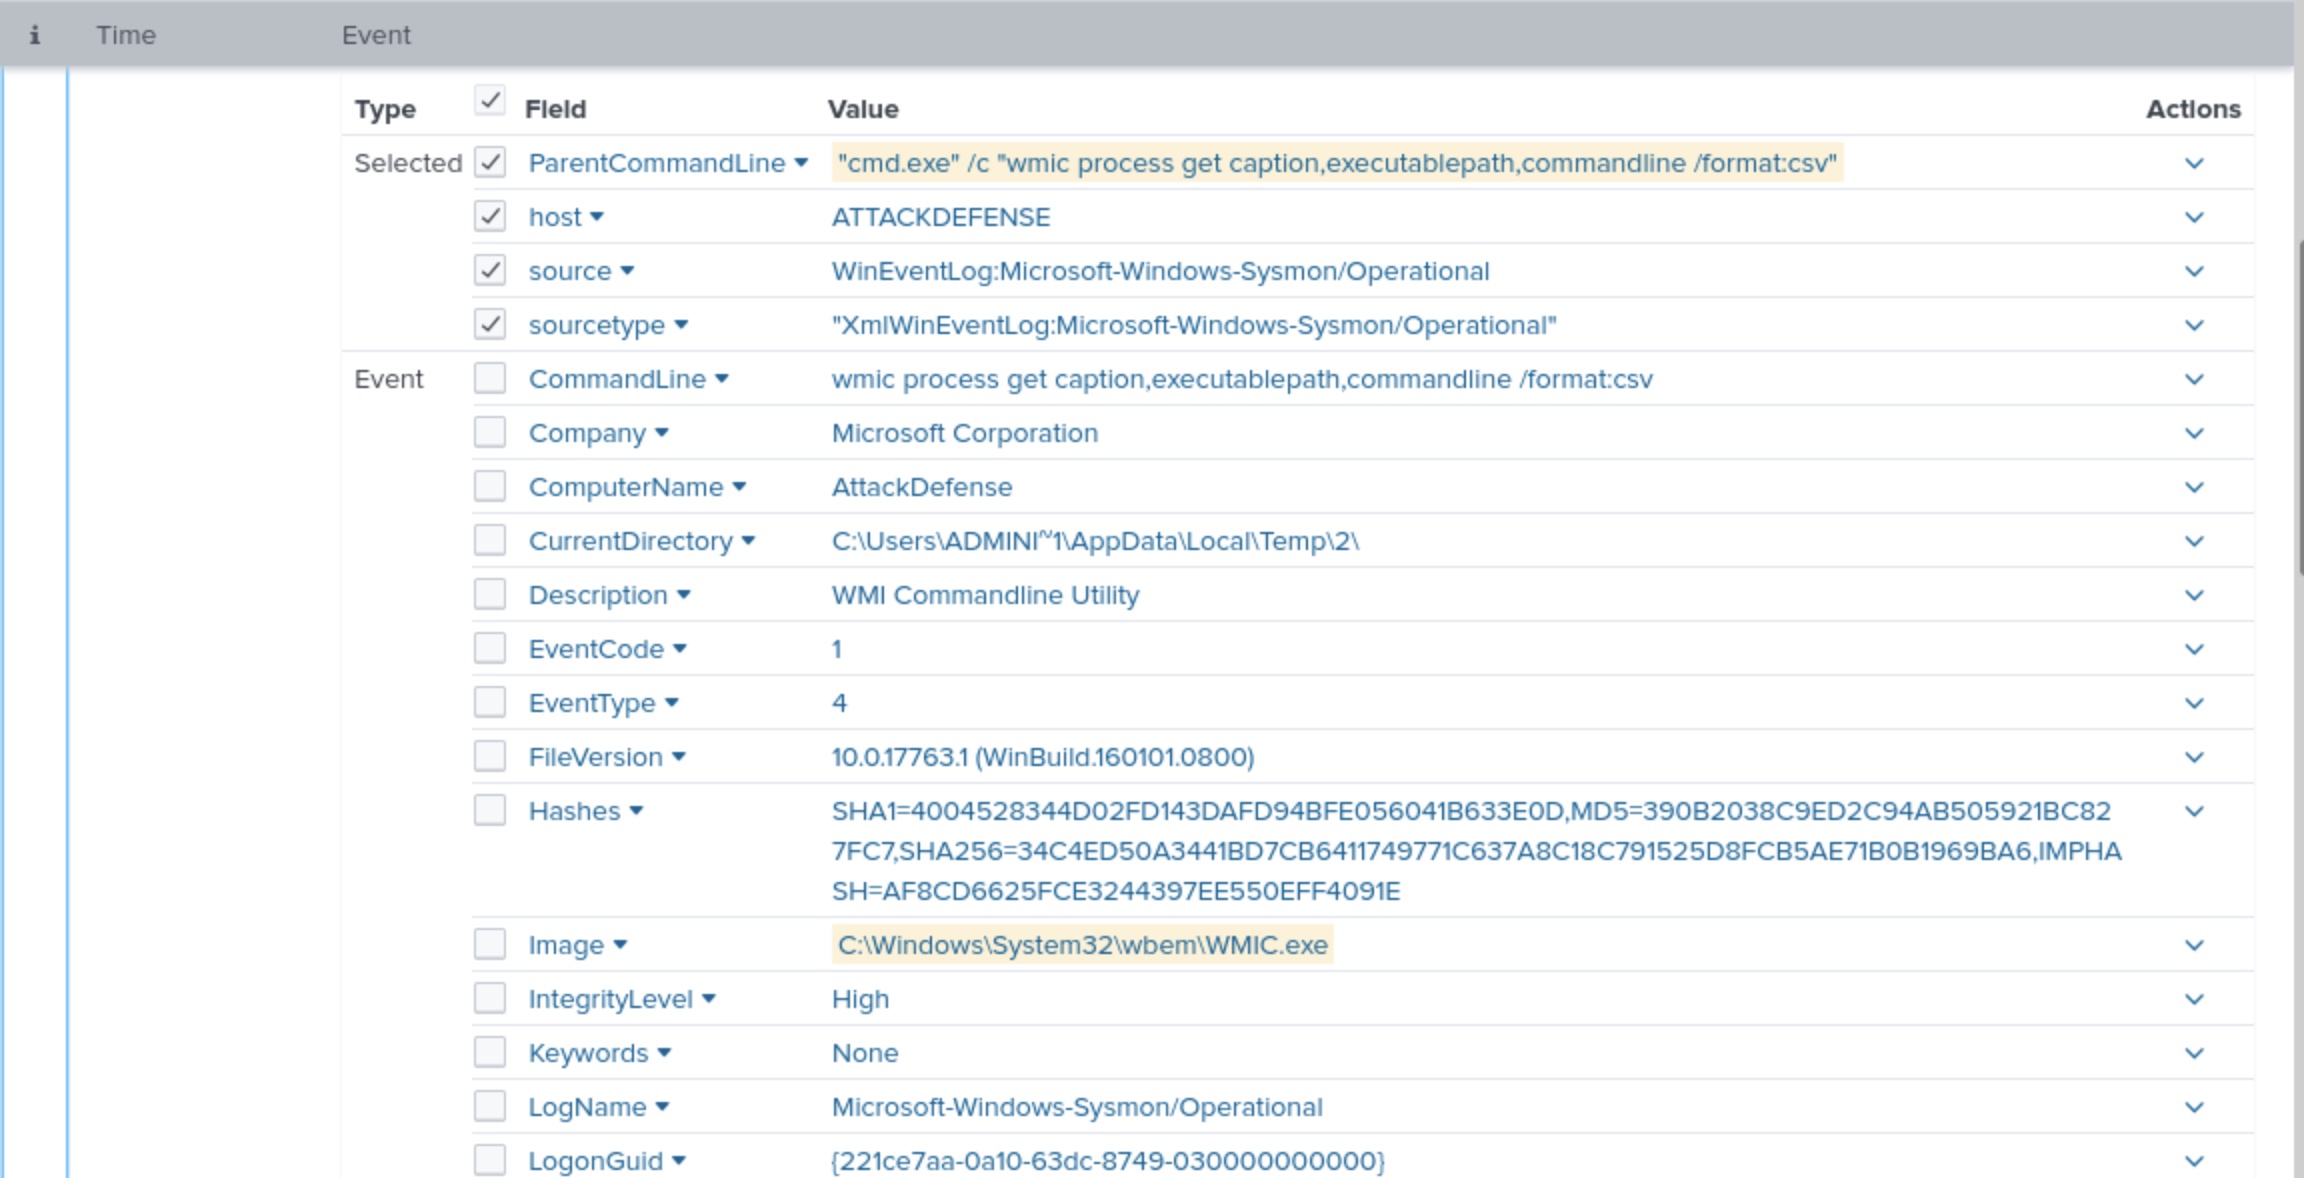
index="sysmon" Image="*WMIC.exe*"WMIC.exe is a built-in Microsoft program that allows command-line access to the WMI. Running this query gives us a bunch of events.
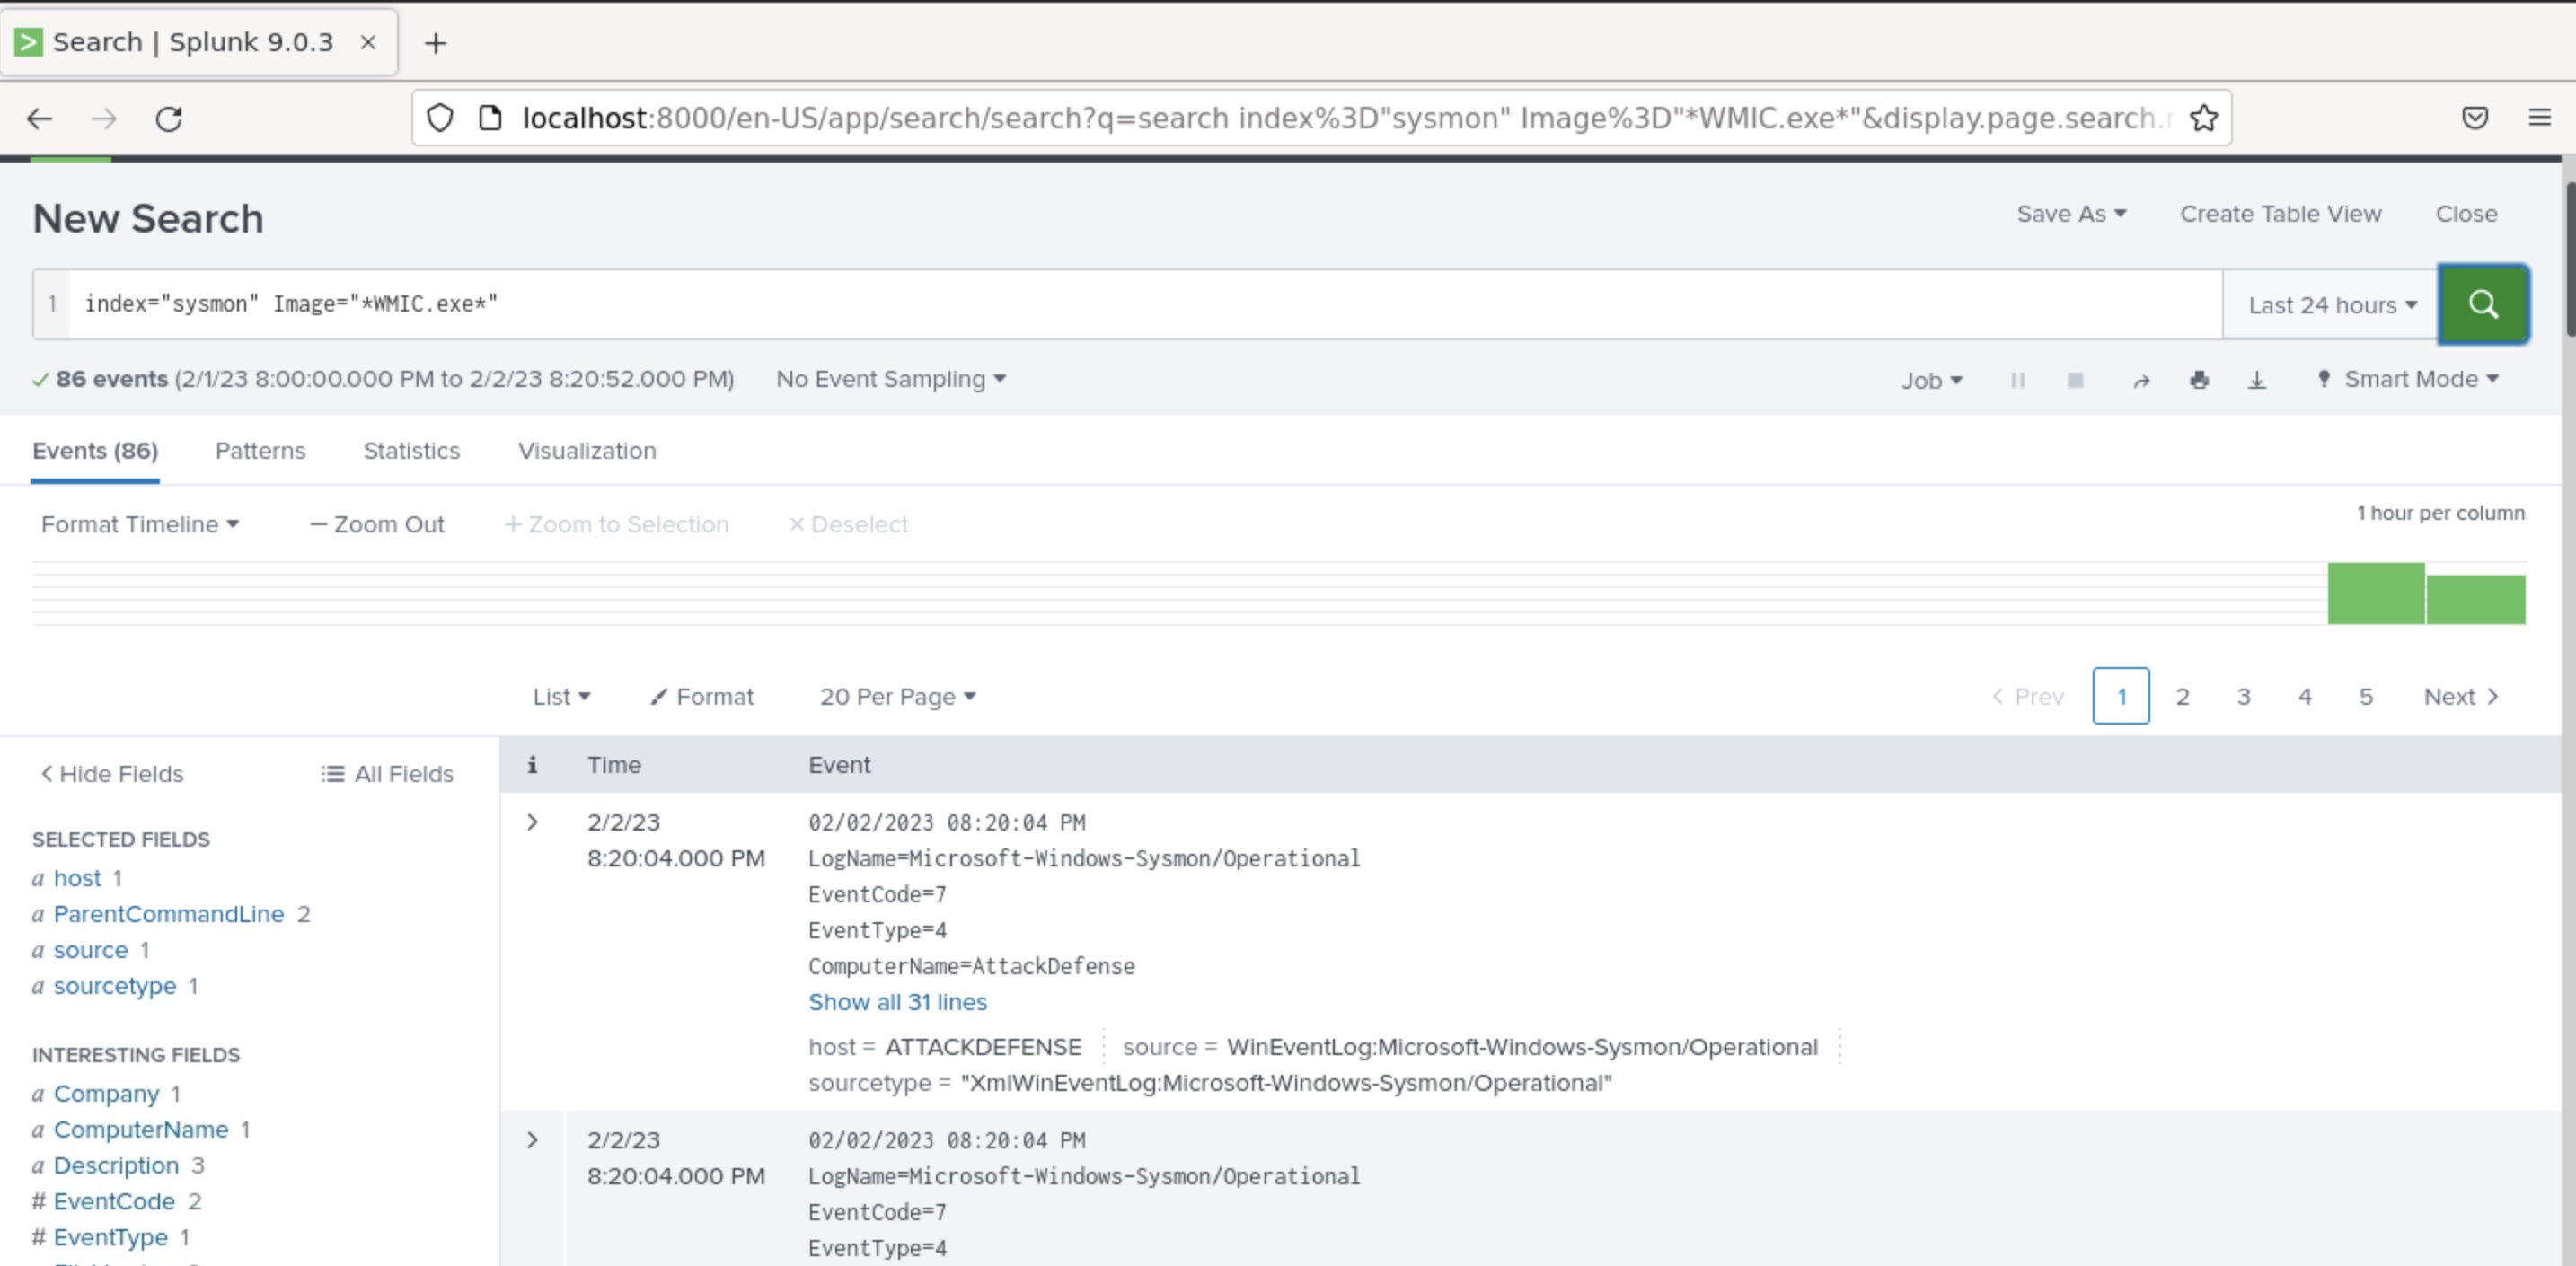
Let's see the ParentCommandLine field values from the left navigation.
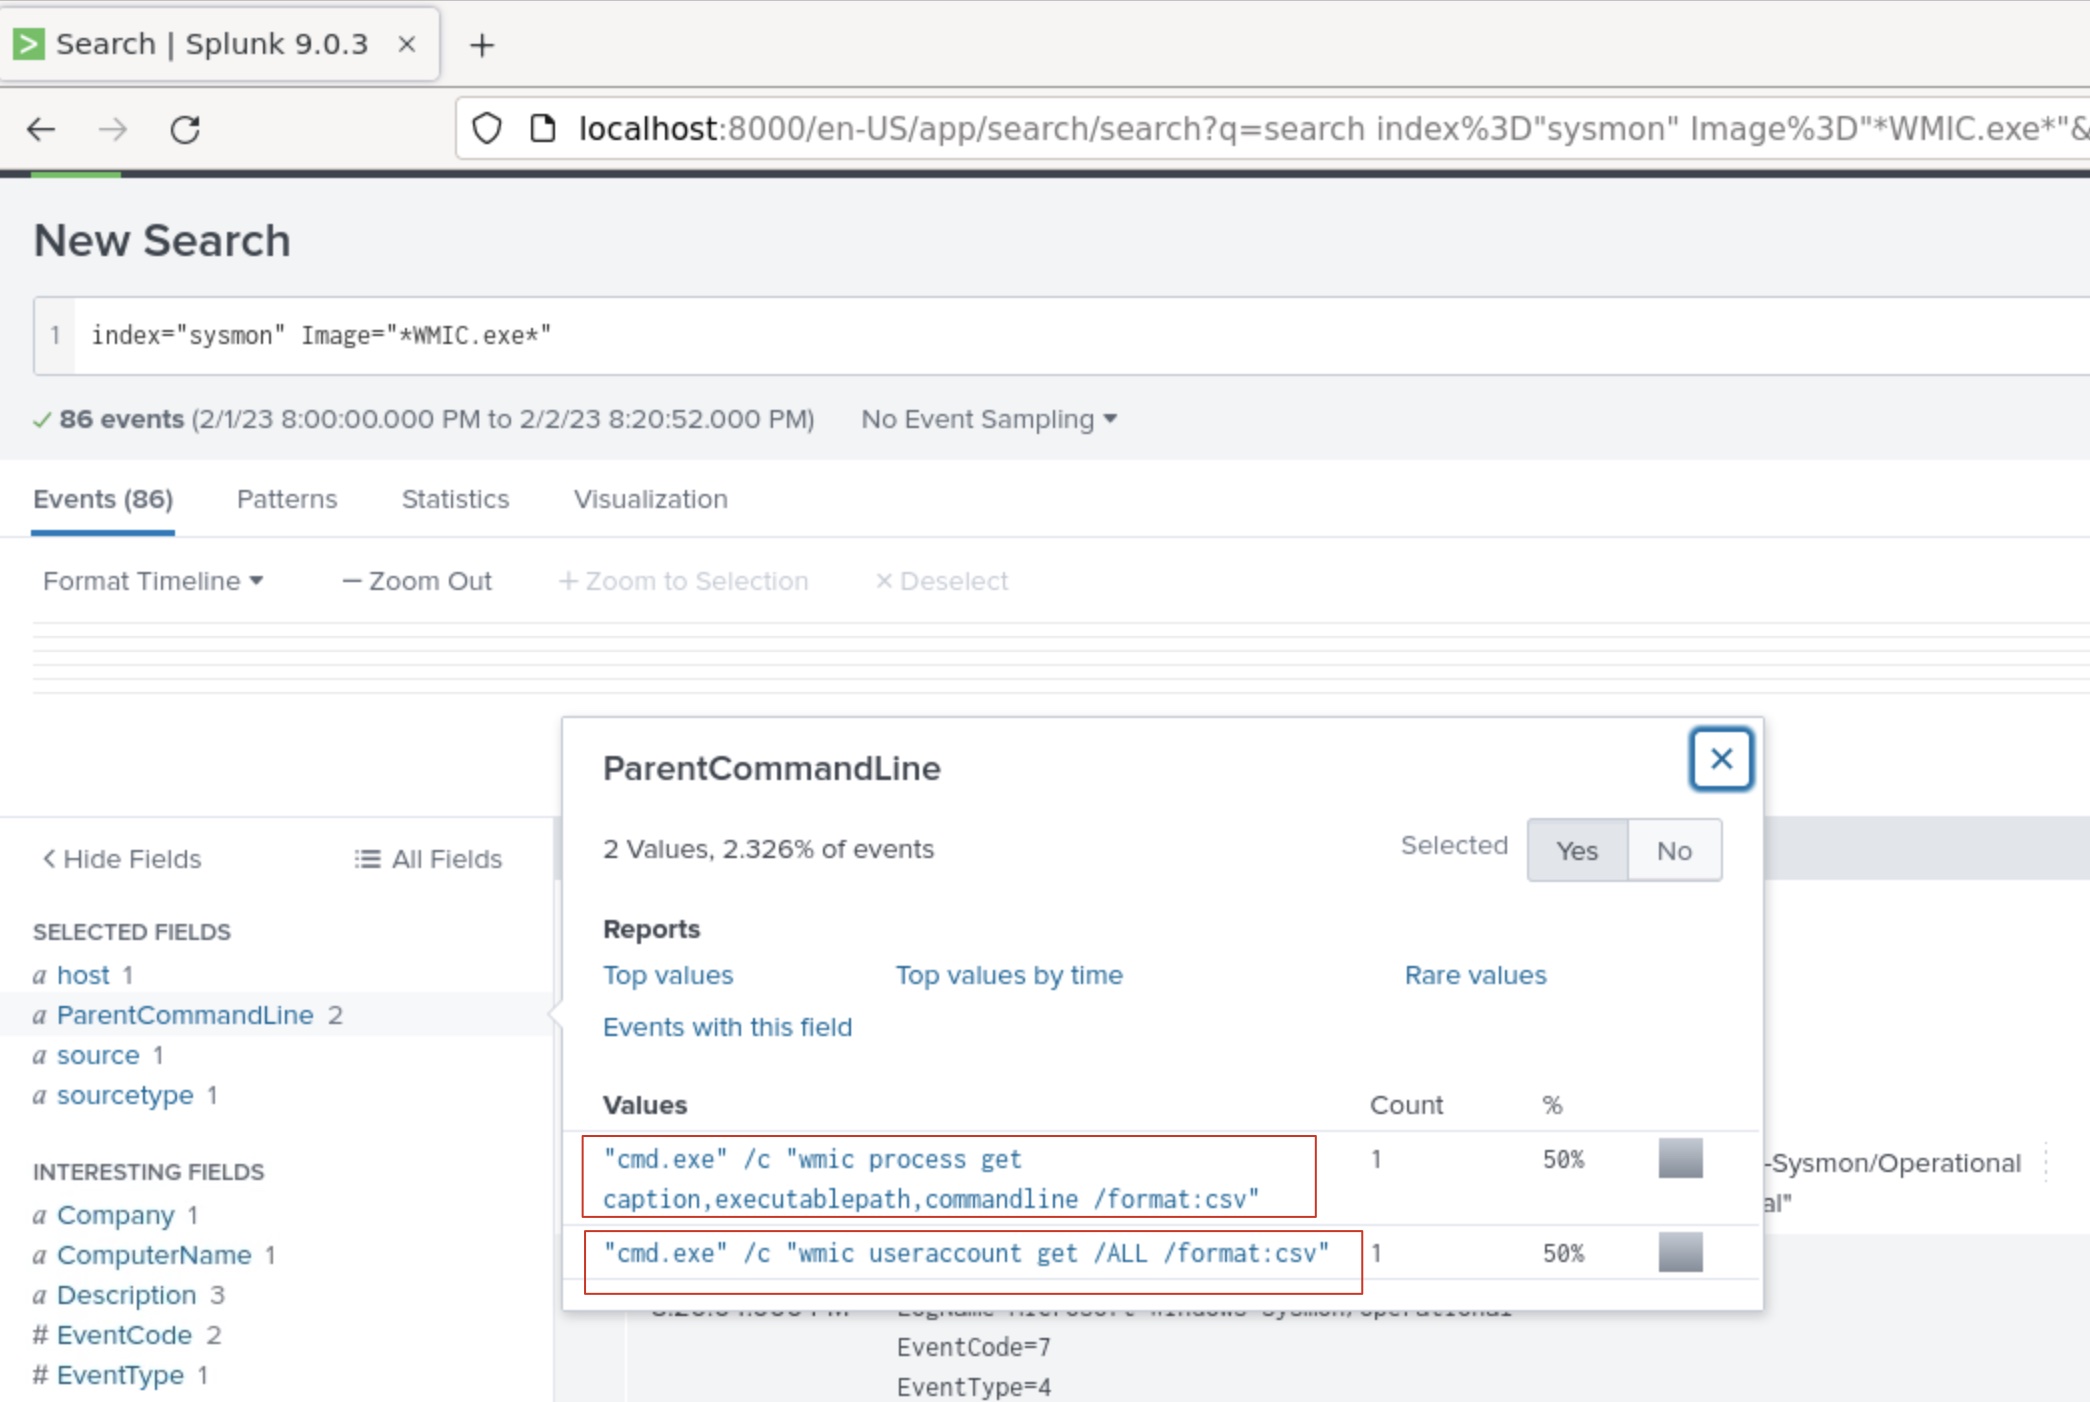
These are some suspicious commands as one tried to gather information regarding the processes and the local users accounts on the system. This could be an attacker.
Clicking on them will take us to their respective events. Let's click on the first value.
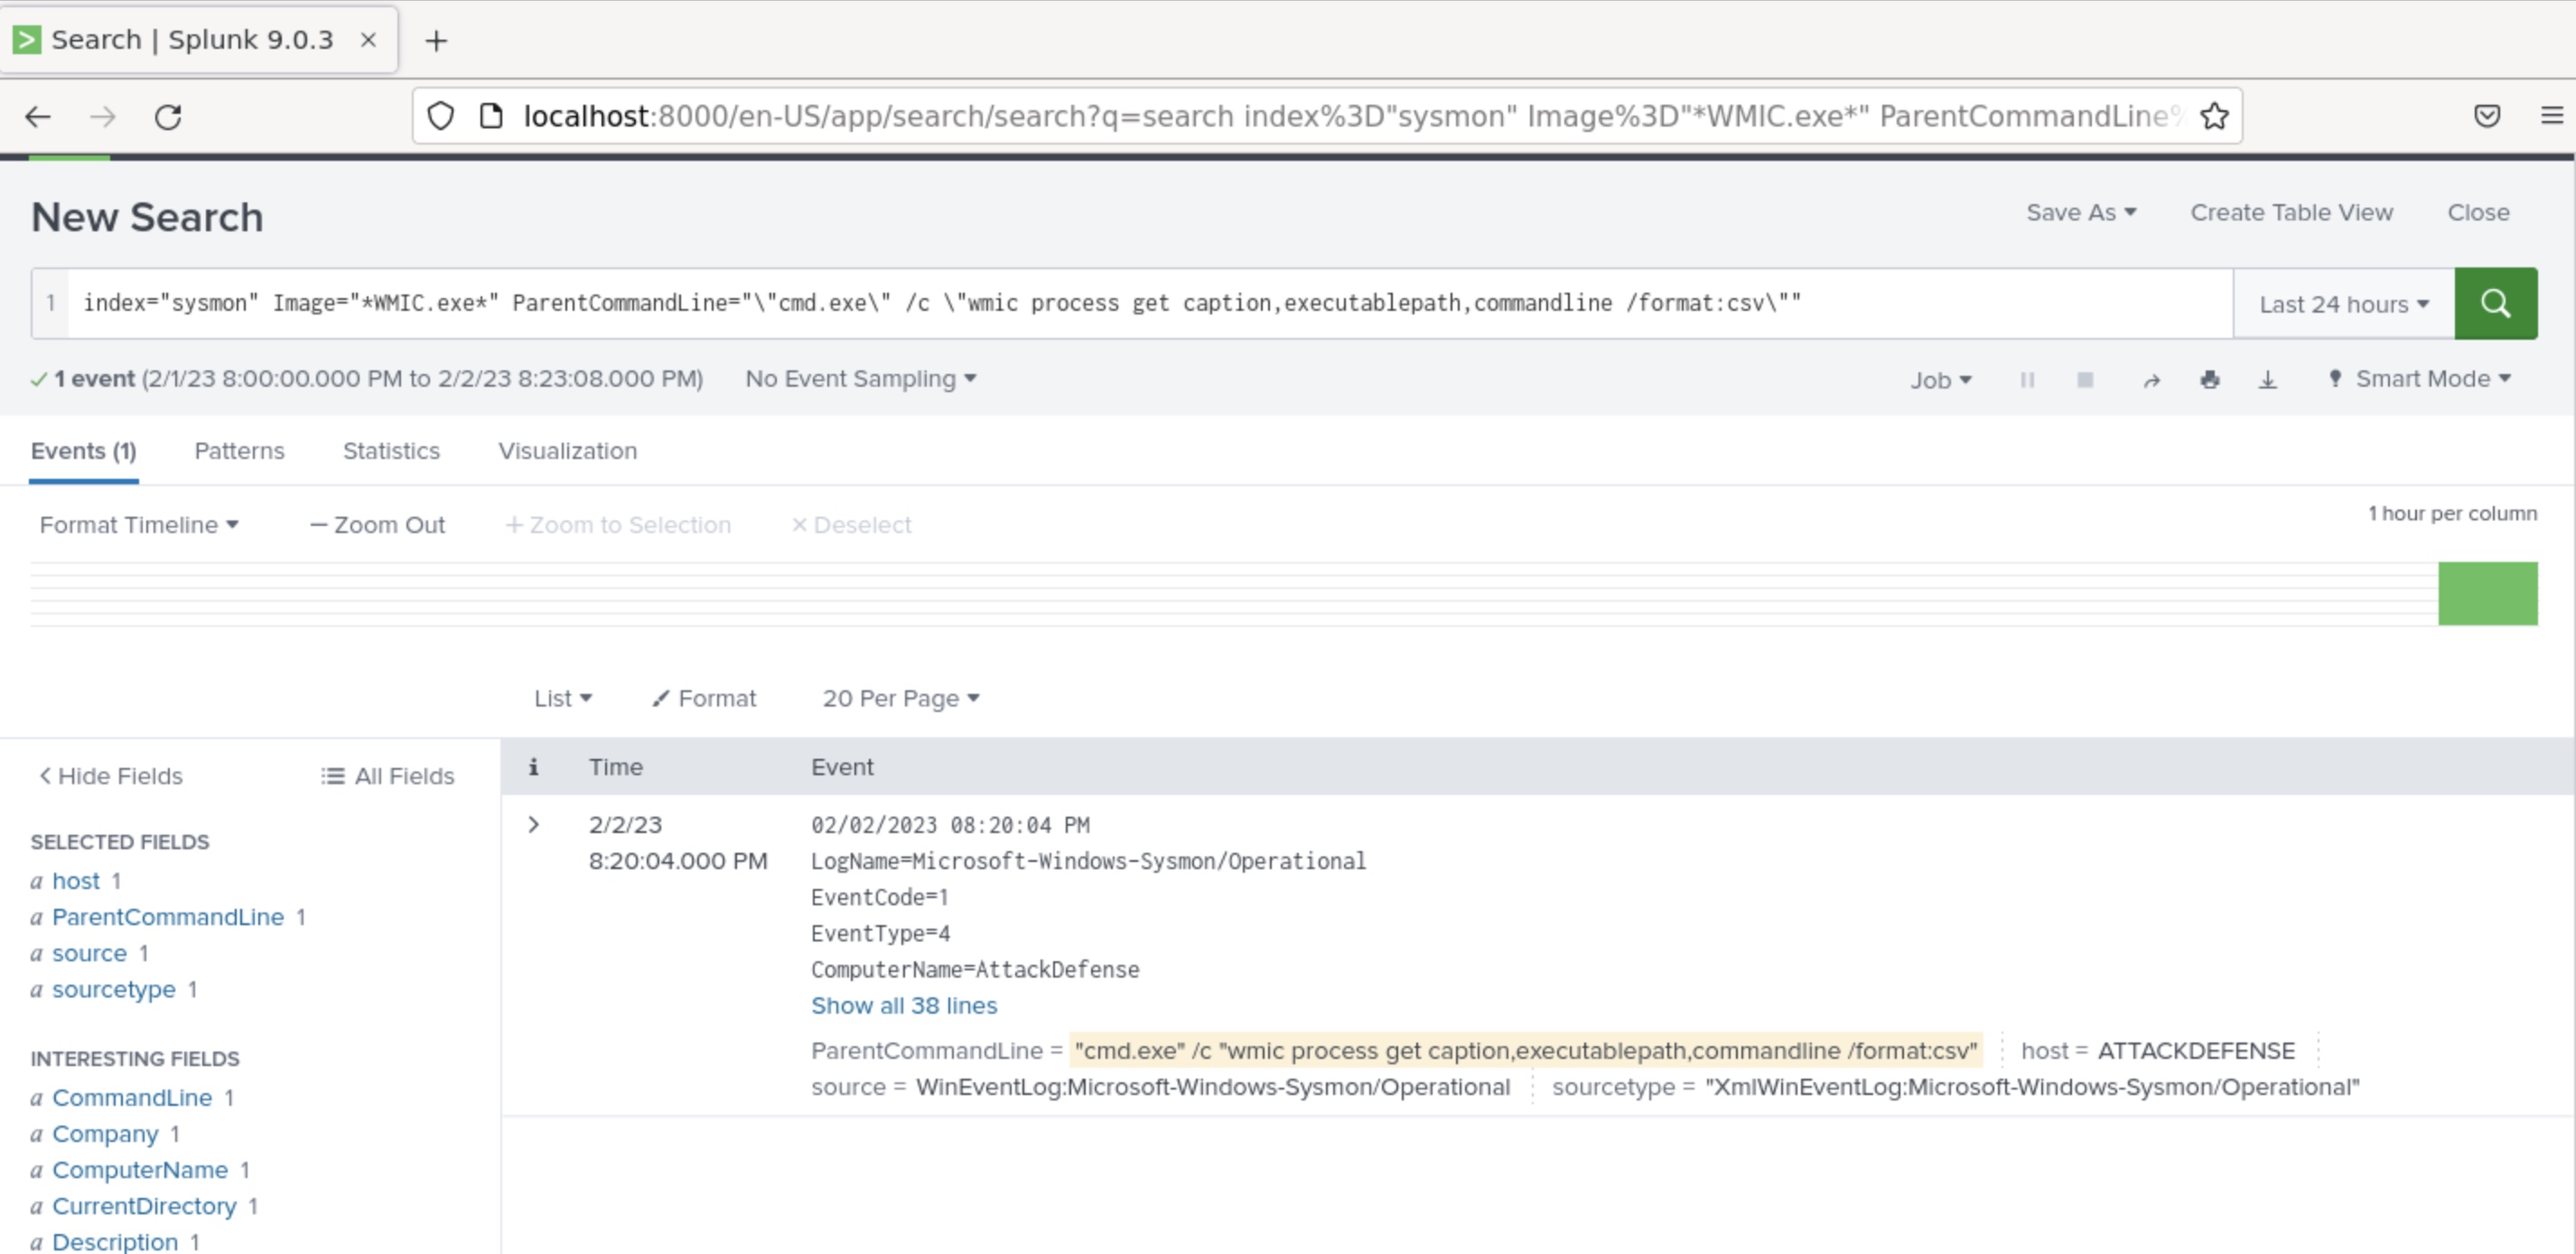
Expand them for more information.
Conclusion
In this lab, we learned how to set up and configure Splunk, Splunk Universal Forwarder and Sysmon. We forwarded Sysmon logs via Splunk Universal Forwarder to Splunk running on the Ubuntu machine. Then we ran basic queries to search through and analyze the data. We also used Atomic Red Team to emulate attacks and attempted to detect the activities of the same on Splunk.